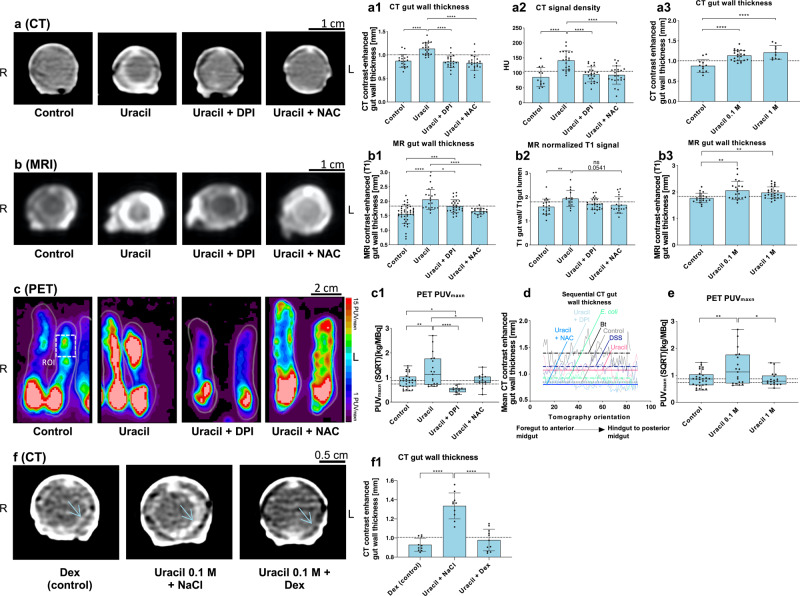
Fig. 8. High-throughput screening of an uracil-induced and DUOX-dependent colitis-like phenotype.
a–c High-throughput CT, MRI, and FDG-PET reveal an uracil-induced colitis-like phenotype, which is ameliorated by the DUOX inhibitor diphenyleneiodonium (DPI) or the ROS scavenger N-acetylcysteine (NAC), a1: n = 85, one-way ANOVA, F(3,81) = 23.77, R2 = 0.4682, P < 0.0001, a2: n = 79, one-way ANOVA, F(3,875) = 14.6, R2 = 0.3687, P < 0.0001, b1: n = 107, one-way ANOVA, F(3,103) = 16.45, R2 = 0.3239, P < 0.0001, b2: n = 80, one-way ANOVA, F(3,76) = 4.016, R2 = 0.1368, P = 0.0104 and c1: n = 75, one-way ANOVA, F(3,71) = 9.627, R2 = 0.2892, P < 0.0001. a3, b3, and e Concentration-dependent effect of DUOX (activated by uracil) and successive worsening of the colitis-like phenotype a3: n = 44, one-way ANOVA, F(2,41) = 16.48, R2 = 0.4457, P < 0.0001, b3: n = 67, one-way ANOVA, F(2,64) = 6.809, R2 = 0.1755, P = 0.0136 and E: n = 66, one-way ANOVA, F(2,63) = 5.014, R2 = 0.1373, P = 0.0095. d Mean sequential CT gut wall thickness curves (the horizontal lines represent the overall treatment-specific mean thickness), preferred model: different curve for each data set, F(6, 535) = 330.2, P < 0.0001). f, f1 CT imaging revealed the rescue of the uracil-induced phenotype by dexamethasone (Dex) treatment, n = 31, one-way ANOVA, F(2,28) = 41.71, R2 = 0.7487, P < 0.0001. Dashed lines indicate threshold values. Significance levels: ns = P > 0.05, *P ≤ 0.05, **P ≤ 0.01, ***P ≤ 0.001 and ****P ≤ 0.0001. Bar charts represent mean and SD. Every data point represents a single animal. Box plots represent 25th–75th percentiles; whiskers represent min-max (show all points), and the centers represent median values. Source data are provided as a Source Data file.

