Figure 3.
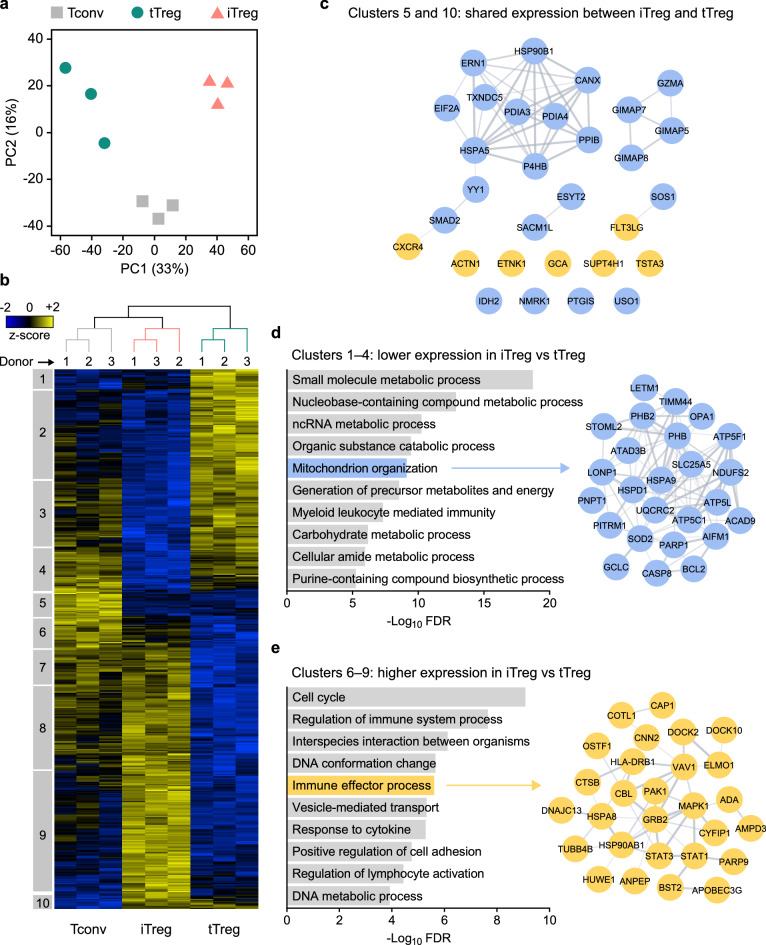
The iTreg, tTreg and Tconv cell proteomes are distinct. (a) PCA plot of the proteome of unstimulated Tconv, tTreg and iTreg cells (n = 3). (b) Heat map showing hierarchical clustering of the 475 proteins that were differentially expressed between unstimulated Tconv, tTreg and iTreg cells (ANOVA, FDR < 0.05). Samples are colored according to cell type as in (a). Z-scores showing relative protein expression values are color-coded. Numbered boxes (1–10) indicate clusters of proteins. (c) STRING network of proteins that have shared low (cluster 5) or high (cluster 10) expression in iTreg and tTreg cells, relative to Tconv cells. Proteins with high or low expression are depicted as yellow or blue nodes, respectively. Protein associations according to STRING are connected with lines. (d) GO enrichment analysis of clusters 1–4 containing proteins with low expression in iTreg cells compared to tTreg cells, showing ten significantly enriched GO biological processes. For example, proteins associated with mitochondrion organization are shown in a STRING network. Blue nodes indicate low expression in iTreg cells relative to tTreg cells. (e) GO enrichment analysis of clusters 6–9 containing proteins with high expression in iTreg cells compared to tTreg cells, showing ten significantly enriched GO biological processes. For example, proteins involved in immune effector processes are displayed in a STRING network. Yellow nodes indicate high expression in iTreg cells relative to tTreg cells.

