Figure 5.
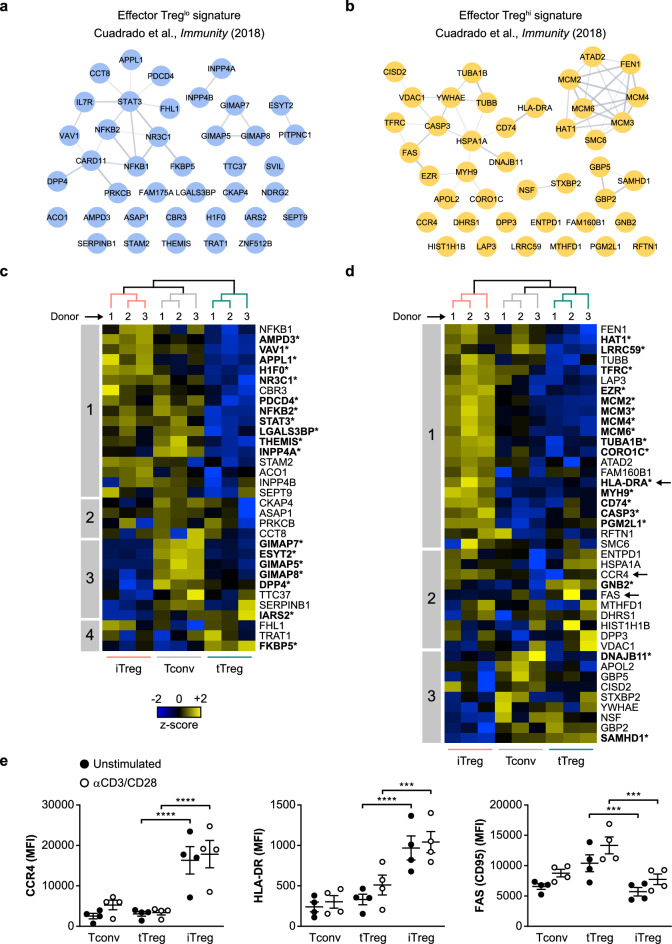
Aspects of an effector Treg cell signature are present in iTreg cells. (a,b) The effector Treg cell signature represents 39 lowly (a) and 41 highly expressed proteins (b) in ex vivo effector Treg cells compared to naïve Treg cells and other CD4+ T cells from human blood22. Shown are STRING networks displaying the lowly and highly expressed proteins as blue and yellow nodes, respectively. (c,d) Heat maps showing hierarchical clustering of the lowly (c) or highly (d) expressed proteins of the effector Treg cell signature based on their expression in unstimulated Tconv, tTreg and iTreg cells (n = 3). Samples are colored according to cell type. Z-scores showing relative protein expression values are color-coded. Numbered boxes indicate clusters of proteins. Significantly differential expression is indicated by asterisks and bold letters (FDR < 0.05). CCR4, HLA-DRA and FAS (CD95) are marked in (d), as these molecules are also analyzed by flow cytometry in (e). (e) Quantification of flow cytometric analysis of the protein expression of surface CCR4 (n = 4), surface HLA-DR (n = 4) and surface FAS (n = 4) on indicated cell populations. MFI is depicted on the y-axis. Two-way ANOVA with Tukey’s post hoc test was used for statistical analysis. Data are presented as mean ± SEM. Sample size (n) represents cells from individual donors, analyzed in independent experiments. ***p < 0.001, ****p < 0.0001.

