
Fig. 5. The relationship between spine density and grey matter volume in a rodent experiment.
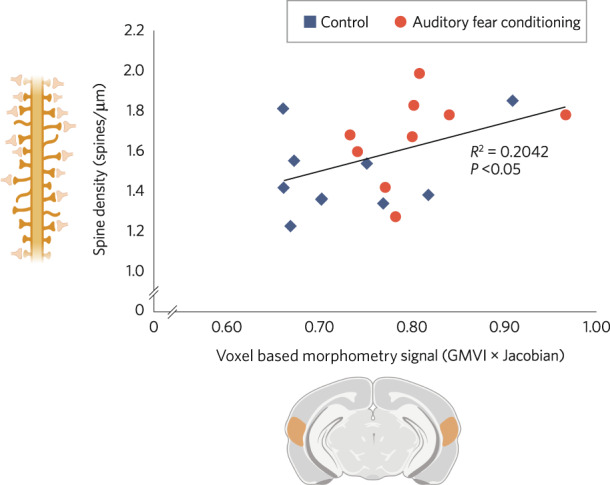
Scatter plot showing a significant correlation between spine density values with the voxel-based morphometry signal (Grey Matter Voxel Intensity (GMVI) x Jacobian) in the auditory cortex of mice in a fear-conditioning experiment (n = 9 per group p = 0.027, Pearson’s correlation R2 = 0.2042, blue = control group, red = auditory fear-conditioned group). Adapted with permission from Keifer et al., 2015.