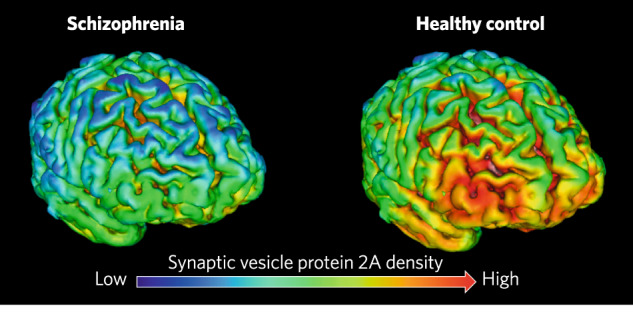
Fig. 6. Whole brain maps of the mean [11 C]UCB-J volume of distribution (VT) in schizophrenia (left) and healthy control (right) groups, indicating lower levels of the synaptic vesicle protein 2 A (SV2A) marker in schizophrenia particularly in fronto-temporal regions, consistent with lower synaptic density in schizophrenia (based on data from Onwordi et al. 2020).

Low [11 C]UCB-J uptake (dark blue) corresponds to VT values in the 10–15 ml/cm3 range, high [11 C]UCB-J (orange-red) corresponds to VT values in the 20–25 ml/cm3 range. Image credit: Onwordi and Howes (2022).
