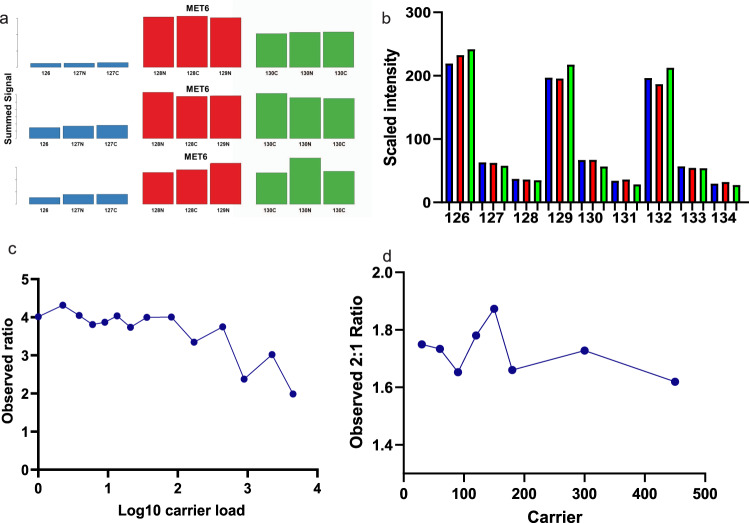
Fig. 2. Assessing the background interference, quantitative accuracy, and carrier proteome effect of pasefRiQ.
a A comparison of results from 3 instruments that following analysis of 200 ng of the TMT-TKO yeast digest standard and visualized using the TVT web tool61. Blue bars, red and green bars represent Δmet6, Δhis4 and Δura2 samples, respectively. (Top) vendor example from an Orbitrap Fusion 2 system using MS3-based quantification. (Middle) vendor example results from a quadrupole Orbitrap system using MS2-based quantification. (Bottom) Results from a pasefRiQ file. b A graph demonstrating the normalized abundance of the E. coli protein TNAa in the two-proteome standard injected at different concentrations on column to illustrate the effects of sample dilution on ratio accuracy. c Quantitative results of a standard protein with a known 5:1 ratio in a two-proteome standard digest with increasing amounts of carrier exceeding 4000x carrier load. d A summary of a second carrier experiment with more precise titrations across between 30x and 300x carrier. Source data are provided as a Source data file.

