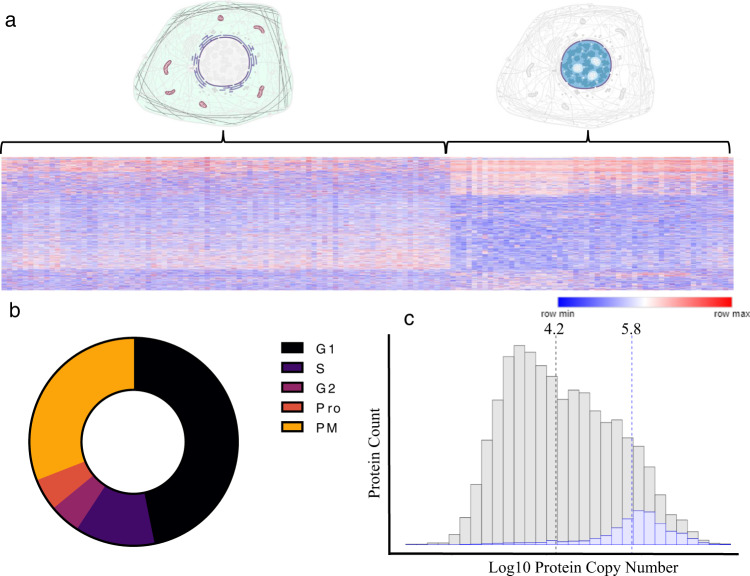
Fig. 3. Characteristics of proteins quantified in single H358 cells.
a A heatmap demonstrating the main clustering characteristics of single cells where columns represent individual cells and rows individual protein normalized abundances. The color scale represents the minimum to maximum protein abundance for each row. b The cell cycle distribution of H358 cells as indicated by the relative abundance of 119 cell cycle protein models. Protein names and source data are provided in the Source data file. c A histogram demonstrating the calculated copy number for 14,178 proteins (gray) compared to the proteins identified in single cells in this study (blue). Dotted lines indicate the median for each group.

