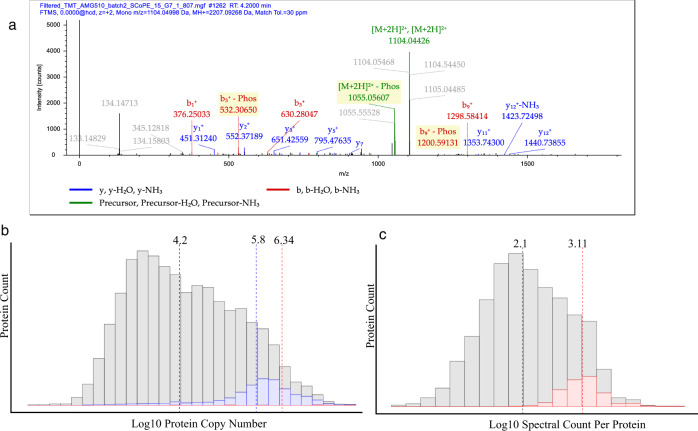
Fig. 4. Phosphoproteins from single cells.
a A fragmentation pattern for LMNA phosphopeptide with sufficient fragmentation data for confident site localization. b A histogram with all proteins identified in single cells (blue) and phosphoproteins (red) compared against the calculated copy number of all proteins with median values highlighted. c A histogram of the displaying the spectral counts for proteins identified in this study (gray) compared to the spectral counts of proteins where phosphopeptides were confidently identified. Dotted lines represent the median for each set of values.

