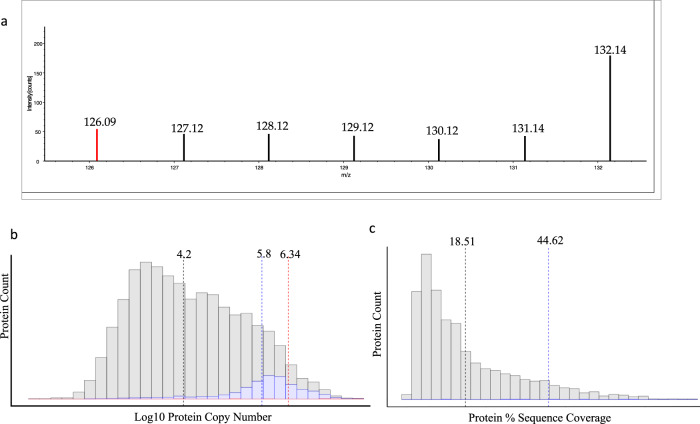
Fig. 5. Acetylated proteins detected in single H358 cells.
a A zoomed-in reporter ion region demonstrating signal for an acetylated histone peptide present in every individual cell in this spectrum. The 126.09 highlighted in red is a diagnostic ion for an acetylated lysine residue. b A histogram illustrating the relative copy numbers of all proteins in this study (gray), all proteins found in single cells (blue), and acetylated proteins (red). Dashed lines indicate median values. c A histogram displaying a comparison between the total protein sequence coverage of all proteins identified in single cells (gray) and the median sequence coverage of acetylated proteins (blue line). Source data are provided as a Source data file.

