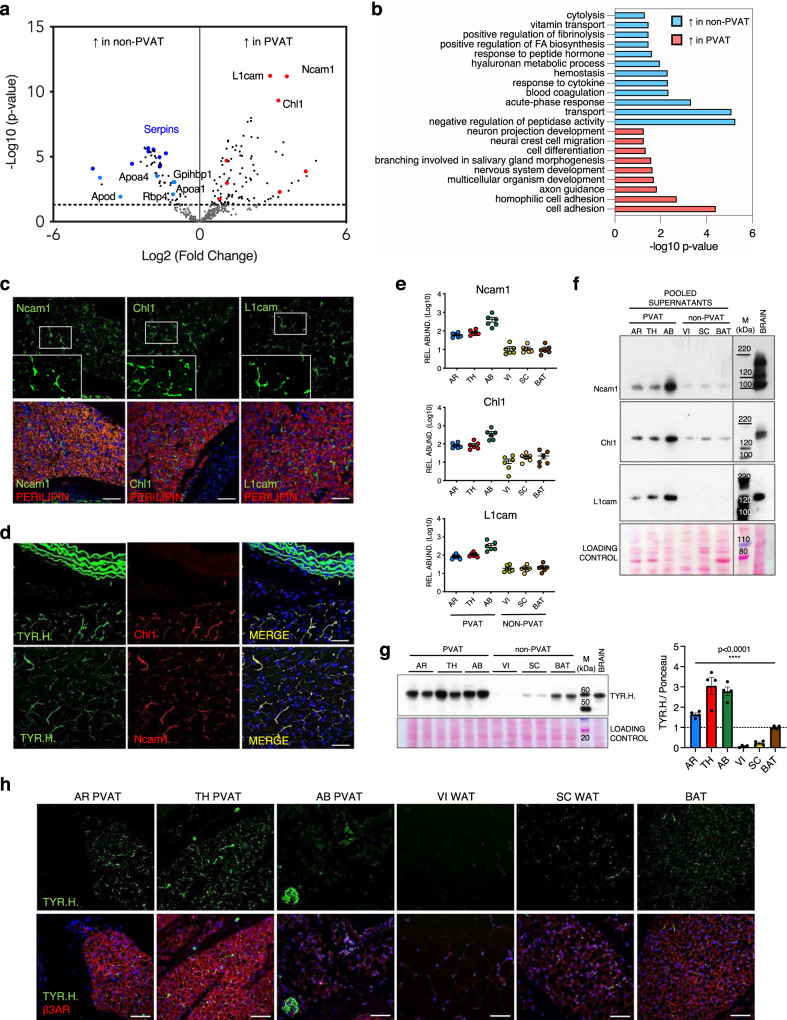
Fig. 2. Identification of a perivascular secretory signature and characterisation of AT innervation.
a Volcano plot showing proteins differentially secreted by perivascular (AR, TH and AB PVAT, N = 18) and non-perivascular (VI and SC WAT and BAT: non-PVAT, N = 18) AT depots (N = 6 biological replicates per depot). The limma package was used to compare different groups using the Ebayes algorithm (paired analysis) followed by Benjamini–Hochberg adjustment. Light-blue spots: proteins involved in lipid transport. Dark blue spots: serpin family members. Red spots: proteins involved in axon guidance and nervous system development. b Gene Ontology analysis showing Biological Processes categories enriched in non-PVAT and PVAT secretomes. Fisher’s Exact test p-values are shown. c Representative immunofluorescence images (from 1 out of 2 replicates) of TH PVAT sections stained for cell-adhesion molecules Ncam1, Chl1 and L1cam. Adipocytes are stained by perilipin. Nuclei are counterstained with DAPI. Insets show higher magnifications of white framed areas. Scale bars: 50 µm. d Representative immunofluorescence images (from 1 out of 2 replicates) showing the co-localisation of cell-adhesion molecules Chl1 and Ncam1 with TYR.H. on TH PVAT sections. Nuclei are counterstained with DAPI. Scale bars: 50 µm. e MS-determined relative abundances of cell-adhesion molecules Ncam1, Chl1 and L1cam in different AT depots secretomes (N = 6 biological replicates per depot, mean ± SEM are shown). f Western blot on pooled AT secretomes stained for cell-adhesion proteins Ncam1, Chl1 and L1cam (N = 6 biological replicates per pool). g Western blot of representative AT lysates stained for the sympathetic marker TYR.H. and relative quantification (N = 4 biological replicates per depot, mean ± SEM, one-way Anova, p = 2.83E-09). h Representative immunofluorescence images (from 1 out of 2 replicates) showing TYR.H. and β3AR staining on different AT depots sections. Nuclei are counterstained with DAPI. Scale bars: 50 µm. AR aortic arch PVAT, TH thoracic PVAT, AB abdominal PVAT, VI visceral AT, SC subcutaneous AT, BAT interscapular brown AT, Ncam1 neural cell-adhesion molecule 1, Chl1 close homologue of L1, L1cam neural cell-adhesion molecule L1, TYR.H. tyrosine hydroxylase, β3AR β3-adrenoreceptor, M molecular weight marker. Source data are provided as a Source Data file.

