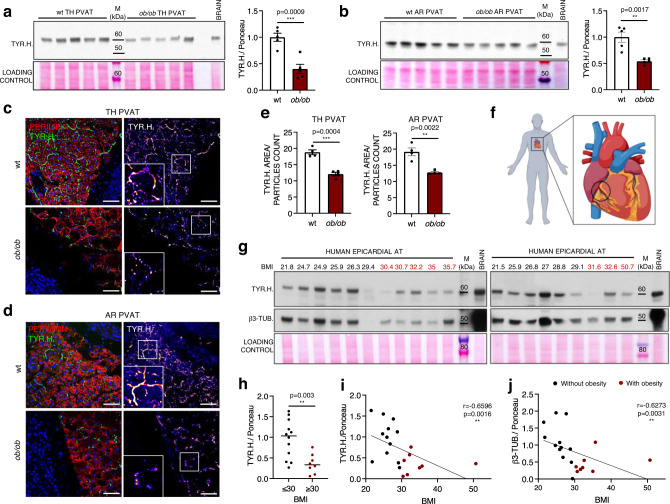
Fig. 4. Sympathetic innervation of murine and human AT depots in obesity.
a, b Western blots showing TYR.H. abundances in wt and ob/ob TH (a) and AR (b) PVAT lysates and relative quantifications. N = 5 biological replicates per group, unpaired, two-tailed independent t-test (unequal distribution). Bar charts show mean ± SEM. c, d Representative immunofluorescence images showing TYR.H. distribution (in green and fire) in wt and ob/ob TH (c) and AR (d) PVAT sections. Adipocytes are labelled by perilipin (in red), nuclei are counterstained with DAPI. Insets show higher magnifications of framed areas. Scale bar: 50 µm. e Bar charts showing the average size of TYR.H. positive particles (mean ± SEM) obtained from 4 mice per condition, with 5 to 10 sections analysed in each mouse. N = 4, unpaired two-tailed independent t-test (unequal distribution). f Schematic cartoon showing the localisation of the human epicardial fat collected for this study. Created with BioRender.com. g Western blot showing TYR.H. and β3-TUB. staining on human epicardial fat lysates from 12 patients without (BMI ≤ 30, in black) and 8 patients with (BMI ≥ 30, in red) obesity. h Scatter dot plot showing the quantification of TYR.H. in epicardial fat samples from patients without (N = 12) and with (N = 8) obesity. Single values and median are shown, unpaired two-tailed independent t-test (unequal distribution). i, j Linear regression analysis showing the correlation between TYR.H. (i) or β3-TUB. (j) levels assessed by Western blot and BMI. N = 20, Spearman correlation analysis, two-tailed p-value. TH thoracic PVAT, AR aortic arch PVAT, TYR.H. tyrosine hydroxylase, BMI body mass index, β3-TUB β3-tubulin, M molecular weight marker. Source data are provided as a Source Data file.

