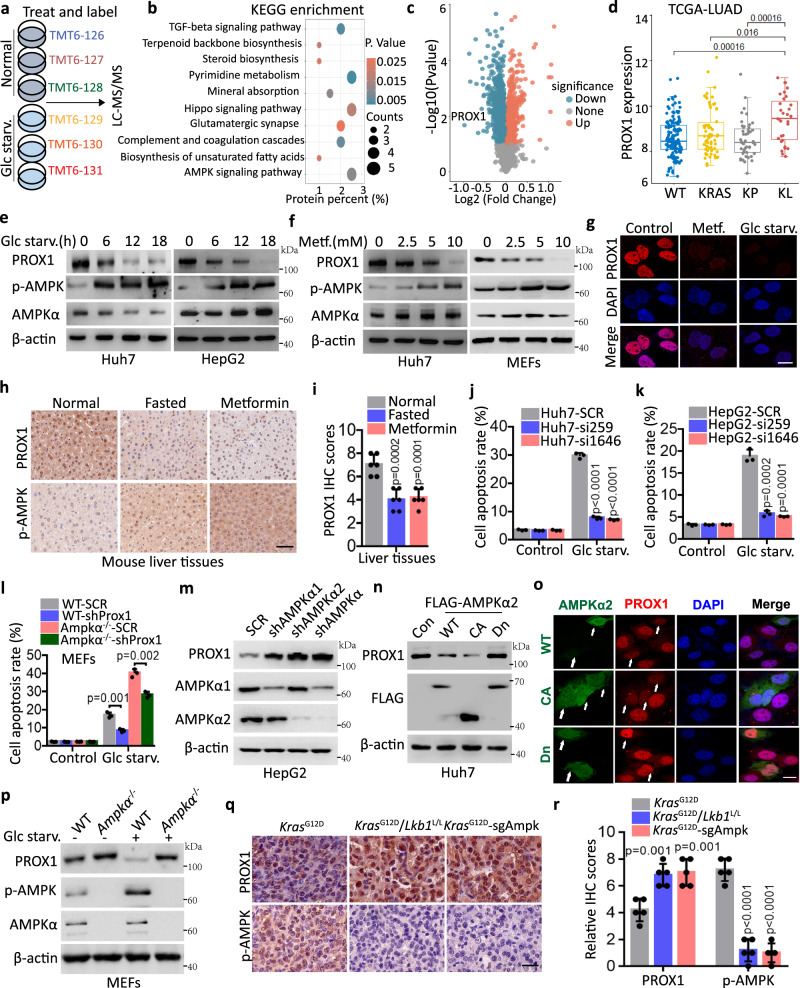
Fig. 1. PROX1 functions as a feedback mechanism mediates tumour cell metabolic plasticity upon glucose starvation.
a, b TMT6 labelled quantitative proteomics (a) to investigate the mechanisms for tumour cell metabolic plasticity and KEGG pathway enrichment analysis (b) the differential protein in the Huh7 cells upon glucose starvation (Glc starv.) for 12 h. c Volcano plot shows the total proteins upon glucose starvation by LC-MS/MS. d Comparison of the PROX1 mRNA level between KRAS/TP53/LKB1 wild-type (WT), single KRAS mutation (KRAS), KRAS/TP53 both mutation and KRAS/LKB1both mutation in the lung adenocarcinoma (LUAD) from TCGA database. WT/KRAS/KP/KL: n = 138/66/47/31, maximum = 11.54/12.69/11.74/11.57, upper quartile = 8.95/9.11/8.76/10.28, median = 8.06/8.36/8.10/9.32, lower quartile = 7.63/7.64/7.47/8.17, minimum = 6.16/6.75/6.31/7.24. e, f Western blot analysis the cell lysates upon glucose starvation (e) and metformin treatment (f) as indicated. g Immunofluorescence analysis the Huh7 cells as indicated (n = 3 independent experiments). Scale bar, 10 µm. h, i Liver tissues from normal, fasted and metformin (500 mg/L) treatment mice (n = 6) are subjected to immunohistochemistry (h) and the corresponding quantified graph of liver tissues (i) are shown. Scale bar, 50 µm. j, k The apoptotic analysis of the Huh7 (j) and HepG2 (k) cells were infected with the lentivirus either expressing PROX1 siRNA (si259 or si1646) precursor or scrambled siRNA precursor (SCR) by flow cytometry (n = 3 independent experiments). l The apoptotic analysis of the wild-type (WT) and AMPKα knockout (Ampkα-/-) MEFs were infected as indicated (n = 3). m Immunoblot analysis the cell lysates as indicated. n Western blot analysis the cell lysates overexpression of the wild-type AMPKα2 (WT-AMPK), the constitutively active AMPK (CA-AMPK) and the dominant-negative AMPK (Dn-AMPK). o Representative confocal images of Huh7 cells transfected with WT-, CA- and Dn-AMPKα2 plasmids (n = 3 independent experiments). Scale bar, 10 µm. p Western blot analysis the cell lysates as indicated. q, r Representative IHC staining images (q) and statistical data (r) in the murine lung tumour tissues from KrasG12D/Lkb1L/L and KrasG12D-sgAmpk mouse (n = 5). Scale bar, 50 µm. The immunoblots are repeated independently with similar results at three times. For i–l and r, data represent the mean ± SD. Statistical significance was assessed using two-tailed unpaired Student’s t-test. Source data are provided as a Source Data file.

