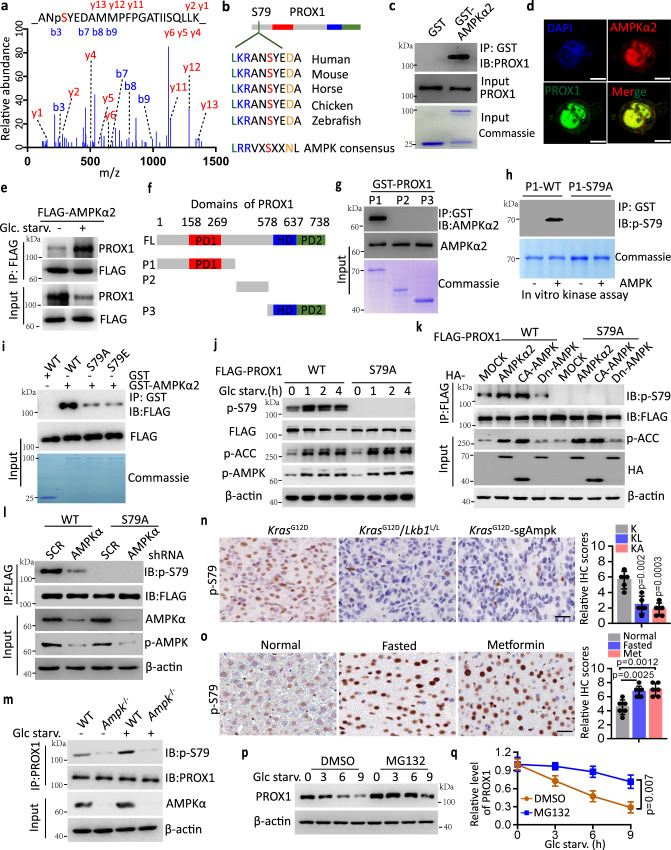
Fig. 2. AMPK directly phosphorylates PROX1 at Ser79.
a The Ser79 phosphorylation modification of PROX1 peptides identified through liquid chromatography-tandem mass spectrometry. b The substrate motif of AMPK kinases is shown (lower), and the Ser79 site of PROX1 is conserved in vertebrate. c Coomassie blue staining of GST and GST-AMPKα2 incubated with in vitro translated PROX1, PROX1 was detected by anti-PROX1 antibody after GST-pulldown. d Endogenous PROX1 and AMPKα2 in the Huh7 cells were visualized under fluorescent microscopy (n = 3 independent experiments). Nuclei were stained with DAPI. Scale bar, 10 µm. e Western blot analysis Huh7 cell lysates as indicated. f The domain organization of PROX1 and the deletion constructs. PD1, prospero domain1; HD, homeodomain; PD2, prospero domain 2. g Input, coomassie blue staining of each GST-PROX1 fragment incubated with in vitro translated AMPKα2. AMPKα2 was detected by anti-AMPKα2 antibody after GST-pulldown. h The P1-WT and P1-S79A of PROX1 as indicated was detected using a phosphor-specific antibody against Ser79 of PROX1. i HEK293T-expressed wide type (WT) and replacement of S79 with Ala (A) or Glu (E) in the FLAG-PROX1 (S79A and S79E) incubated with GST-AMPKα2. j Western blot analysis HEK293T cell lysates as indicated. k Immunoblot analysis of HEK293T cell lysates transfected with the indicated PROX1 and HA-AMPKα2 plasmids. l Immunoblot analysis of the FLAG-IP and cell lysates from transfected with the indicated constructs. m Immunoblot analysis of MEFs cell lysates as indicated. n Representative IHC staining images and statistical data of the murine lung tumour tissues from KrasG12D (K), KrasG12D/Lkb1L/L (KL) and KrasG12D-sgAmpk (KA) mouse (n = 5). Scale bar, 50 µm. o Representative IHC staining images and statistical data of the liver tissues from normal, fasted and metformin (500 mg/L) treatment mice (n = 6). Scale bar, 50 µm. p, q Representative western blot (p) and the corresponding quantified graph (q) of Huh7 cell lysates are shown. n = 3 independent experiments. IB, immunoblot; IP, immunoprecipitation. The immunoblots are repeated independently with similar results at three times. For n, o and q, data represent the mean ± SD. Statistical significance was assessed using two-tailed unpaired Student’s t-test. Source data are provided as a Source Data file.

