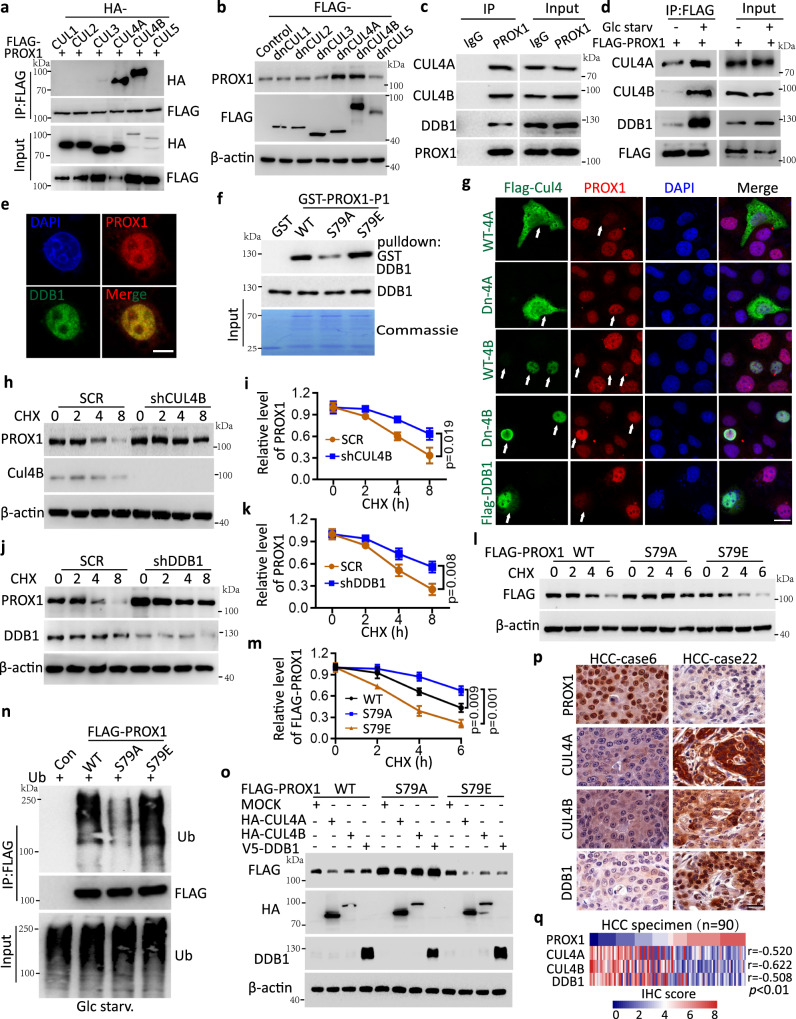
Fig. 3. Ser79 phosphorylation destabilizes PROX1 in a CUL4-DDB1 E3 ligase-dependent manner.
a Interaction between PROX1 and CUL proteins were analyzed in the HEK293T cells. IP, immunoprecipitation. b Immunoblot analysis of the cell lysates from Huh7 cells transfected with the indicated dominant-negative CUL (dn-CUL1, 2, 3, 4 A, 4B and 5) constructs. c Endogenous PROX1 in the Huh7 cells treated with MG132 (4uM) was immunoprecipitated using anti-PROX1 antibody or isotype IgG control and subjected to immunoblot analysis. d HepG2 cells transfected with FLAG-PROX1 were deprived of glucose for 8 h in the presence of MG132. e Representative confocal images from Huh7 cells (n = 3 independent experiments). Scale bar, 10 µm. f Purified recombinant GST-PROX1 (P1-WT, S79A and S79E) was incubated with DDB1 individually. g Representative confocal images of PROX1 expression in the Huh7 cells transfected with WT- and Dn-CUL4A, 4B constructs, and Flag-DDB1 as the indicated (n = 3 independent experiments). Scale bar, 20 µm. h, i HepG2 cells infected with shRNA lentivirus encoding scramble (SCR) and shCUL4B were treated cycloheximide (CHX, 100 mg/mL). Representative western blot (h) and the corresponding quantified graph (i) are shown (n = 3 independent experiments). j, k HepG2 cells infected with the lentivirus as indicated. Representative western blot (j) and the corresponding quantified graph (k) are shown (n = 3 independent experiments). l, m HEK293T cells transfected with FLAG-PROX1 variants upon glucose starvation were subject to CHX (100 mg/mL) treatment. Representative western blot (l) and the corresponding quantified graph (m) are shown (n = 3 independent experiments). n Ubiquitination levels of FLAG-PROX1 variants in the HEK293T cells upon glucose starvation were immunoprecipitated using anti-FLAG mAb and subjected to immunoblot analysis. o Immunoblot analysis of the cell lysates from HEK293T cells co-transfected plasmids as indicated. p, q Representative IHC staining images (p) and the heatmap (q) of IHC score (by Pearson’s) between PROX1, CUL4A, CUL4B and DDB1 expression in HCC tissues (n = 90). Scale bar, 50 µm. The immunoblots are repeated independently with similar results at three times. For i, k and m, data represent the mean ± SD. Statistical significance was assessed using two-tailed unpaired Student’s t-test. Source data are provided as a Source Data file.

