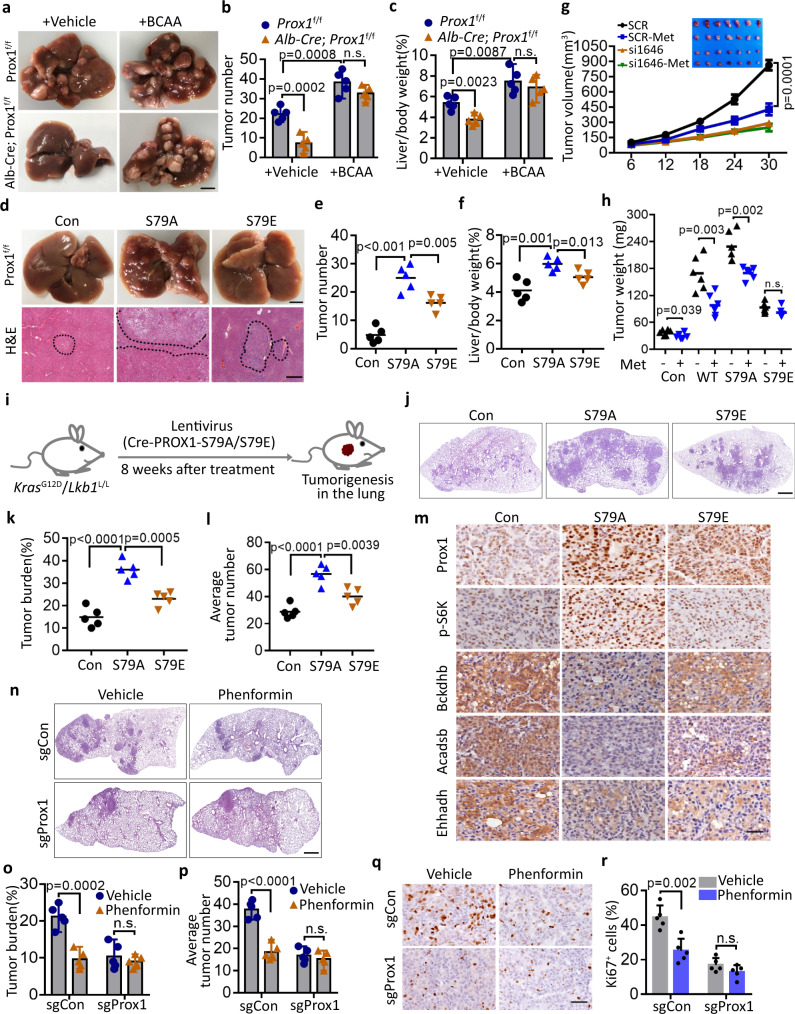
Fig. 6. AMPK-PROX1 axis impairs tumourigenesis and dictates therapeutic response.
a–c Analysis of Prox1f/f (WT) and Alb-Cre; Prox1f/f (Prox1-cKO) mice with DEN-induced liver cancer with normal or high BCAA (200%) diets. Representative images of livers (a) and the number of tumours (b), and the Liver/body weight (c) of the mice (n = 5) as indicated. Scale bar, 1 cm. d–f Representative images and H&E staining of livers (d) and the number of tumours (e), and the Liver/body weight (f) of the mice (n = 5) as indicated. g Huh7 cells stably expressing the indicated siRNAs were subcutaneously injected into in nude mice respectively with or without metformin (500 mg/L) treatment. Shown are average tumour volumes over time (n = 7). Data are presented as mean ± SEM. h SMCC-7721 cells stably overexpressing the PROX1 variants were subcutaneously injected into nude mice respectively with or without metformin (500 mg/L) treatment as indicated, and the weights of tumours are shown (n = 6). i Schematic model of lung tumourigenesis from KrasG12D/Lkb1L/L mice treated with a lenti-Cre-PROX1 virus. Eight weeks after nasal inhalation, mice were killed and analysed. j–k Representative H&E image (j) of lung tumour are shown. Scale bar, 500 µm. The tumour burden (k) and average tumour numbers (l) were calculated and plotted (n = 5 mice for each group). m Immunohistochemistry analysis of the levels of Prox1, p-S6K, Bckdhb, Acadsb and Ehhadh in the above tissues as indicated. Scale bar, 50 µm. n–p Representative the H&E image (n) of lung tumour from KrasG12D/Lkb1L/L mice treated with a lenti-Cre-sgPROX1 and sgSCR virus as indicated with or without phenformin (1.5 g/L) treatment (n = 5 mice for each group). Scale bar, 500 µm. Statistical analysis of the tumour burden (o) and average tumour numbers (p) were shown. q, r Representative IHC staining images (q) and statistical data (r) of Ki67 expression in the above tissues (n = 5) as indicated. Scale bar, 50 µm. For b–c, e–f, h, k–l, o–p and r, data represent the mean ± SD. Statistical significance was assessed using two-tailed unpaired Student’s t-test. n.s. not significant. Source data are provided as a Source Data file.

