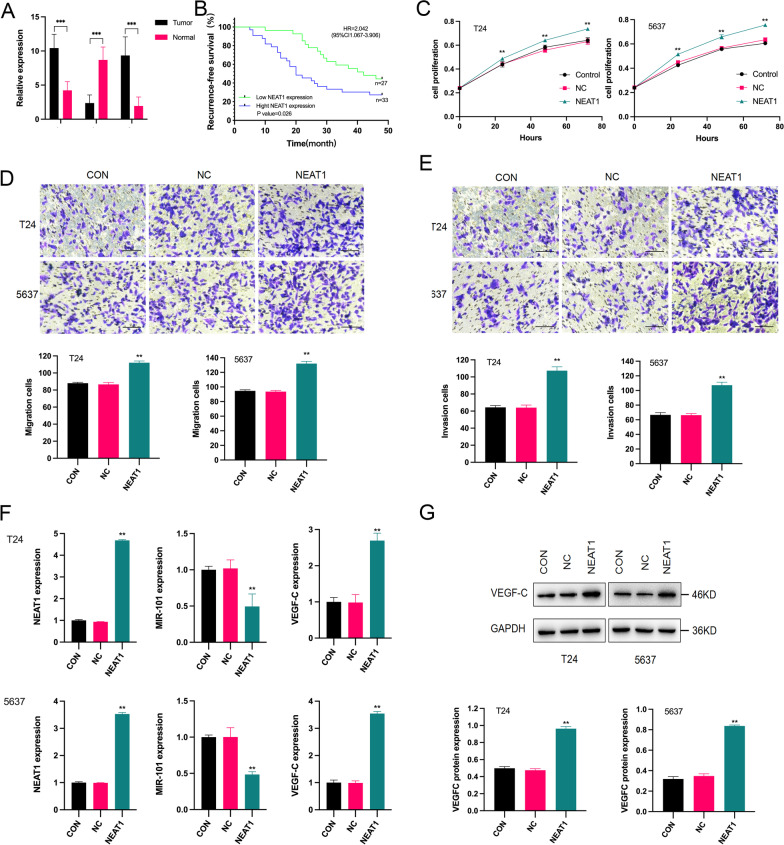
Fig. 1.
The expression of NEAT1, miR-101 and VEGF-C in BC and the effects on BC cells. A The expression of NEAT1 and VEGF-C in the tumour tissues was significantly higher than that in the normal tissues. The expression of miR-101 in tumour tissues was significantly lower than that in the normal tissues. ***p < 0.001 tumour tissues versus normal tissues. B The results of Kaplan–Meier analysis revealed that BC patients with high NEAT1 expression presented poor recurrence-free survival. p = 0.026 high NEAT1 expression group versus low NEAT1 expression group (HR = 2.042, 95% CI 1.067–3.906). C After 24 h, the proliferation of the cells in the NEAT1 group was significantly higher than that in the CON and NC groups in both T24 and 5637 cells. **p < 0.01 NEAT1 group versus CON and NC groups. D, E The qualitative results of the migration and invasion assays showed that the migration and invasion of the cells in the NEAT1 group were significantly higher than those in the CON and NC groups, both in T24 and 5637 cells. **p < 0.01 NEAT1 group versus CON and NC groups. F The mRNA expression of NEAT1 and VEGF-C was significantly increased after NEAT1 transfection, both in T24 and 5637 cells. **p < 0.01 NEAT1 group versus CON and NC groups. The mRNA expression of miR-101 was significantly decreased after NEAT1 transfection. **p < 0.01 NEAT1 group versus CON and NC groups. G VEGF-C protein expression was significantly increased after NEAT1 transfection, both in T24 and 5637 cells (Additional file 1: Figure S1). **p < 0.01 NEAT1 group versus CON and NC groups

