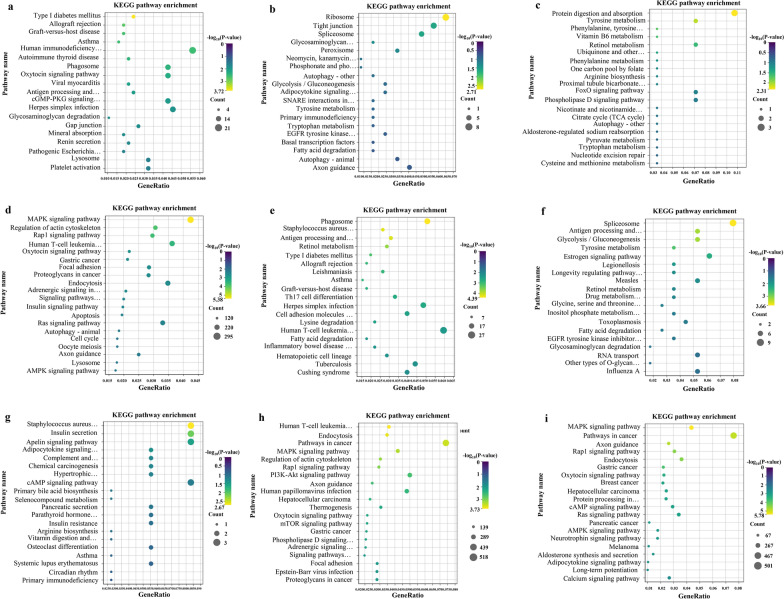
Fig. 4.
Analysis of the KEGG pathway. a–dThe top 20 pathways enriched by genes regulated by differentially expressed lncRNAs, mRNAs, miRNAs in HCT-8 cells at 3 hpi. e–i The top 20 pathways enriched by genes regulated by differentially expressed lncRNAs, mRNAs, miRNAs, circRNA in HCT-8 cells at 12 hpi. The vertical axis represents the pathway name and the horizontal axis represents the gene ratio. The size of the filled circle represents the number of differentially expressed genes in the pathway, and the color of the filled circle corresponds to the different -log10 (P-value) ranges. KEGG, Kyoto Encyclopedia of Genes and Genomes

