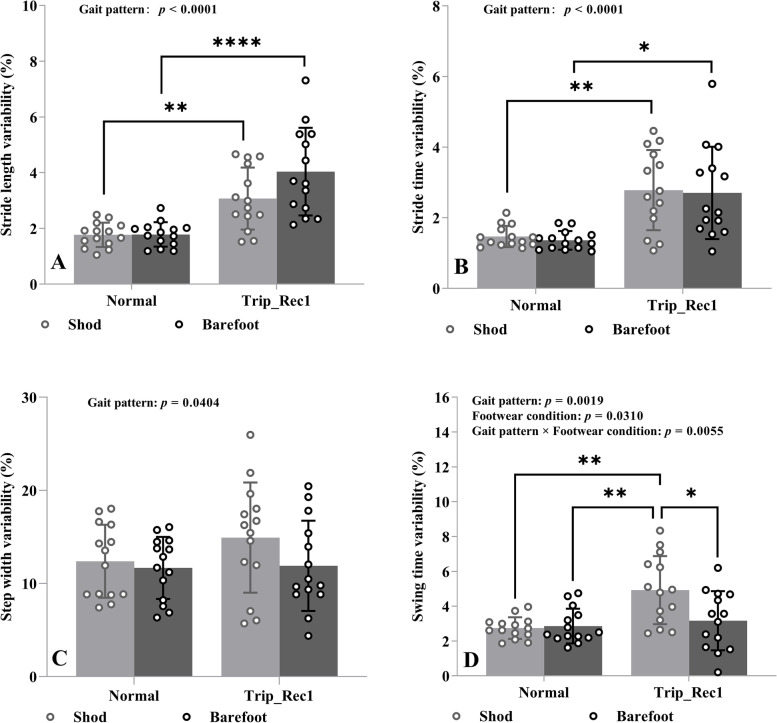
Fig. 2.
Effects of gait pattern (normal versus trip-Rec1) and footwear condition (shod versus barefoot walking) on stride length variability (A), stride time variability (B), step width variability (C), and swing time variability (D). The interleaved scatter with bars and error bars indicates mean values and standard deviation, showing with the individual values. Variability was defined as the coefficient of variation (CoV, %) calculated as the standard deviation divided by the mean value. Gait pattern effect, footwear condition effect and the interaction effect between the two are shown at the top of each plot. Asterisks represent p-value classification for Tukey’s post hoc multiple comparisons. *: p < 0.05, **: p < 0.01; ****: p < 0.0001

