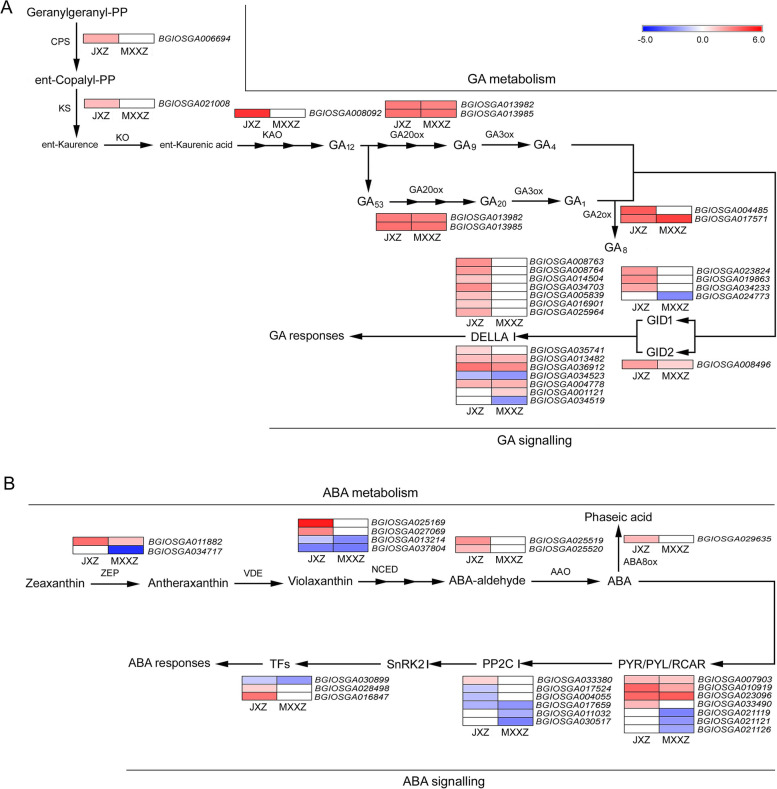
Fig. 5.
Heatmap diagram showing the DEGs involved in the metabolism and signalling of GA (A) and ABA (B) in JXZ and MXXZ under control and high humidity conditions. DEGs were analysed in two comparisons, JXZ-T vs. JXZ-C (JXZ) and MXXZ-T vs. MXXZ-C (MXXZ). "JXZ-C," "JXZ-T," “MXXZ-C,” and “MXXZ-T” indicate the control (C) and PHS-induced (T) samples of the JXZ and MXXZ varieties, respectively. The colour gradient shows the relative expression levels of DEGs from low (blue indicates downregulation) to high (red indicates upregulation). The numerical values of the blue-to-red gradient bar represent the log2 fold change in expression for the high humidity treatment relative to the control

