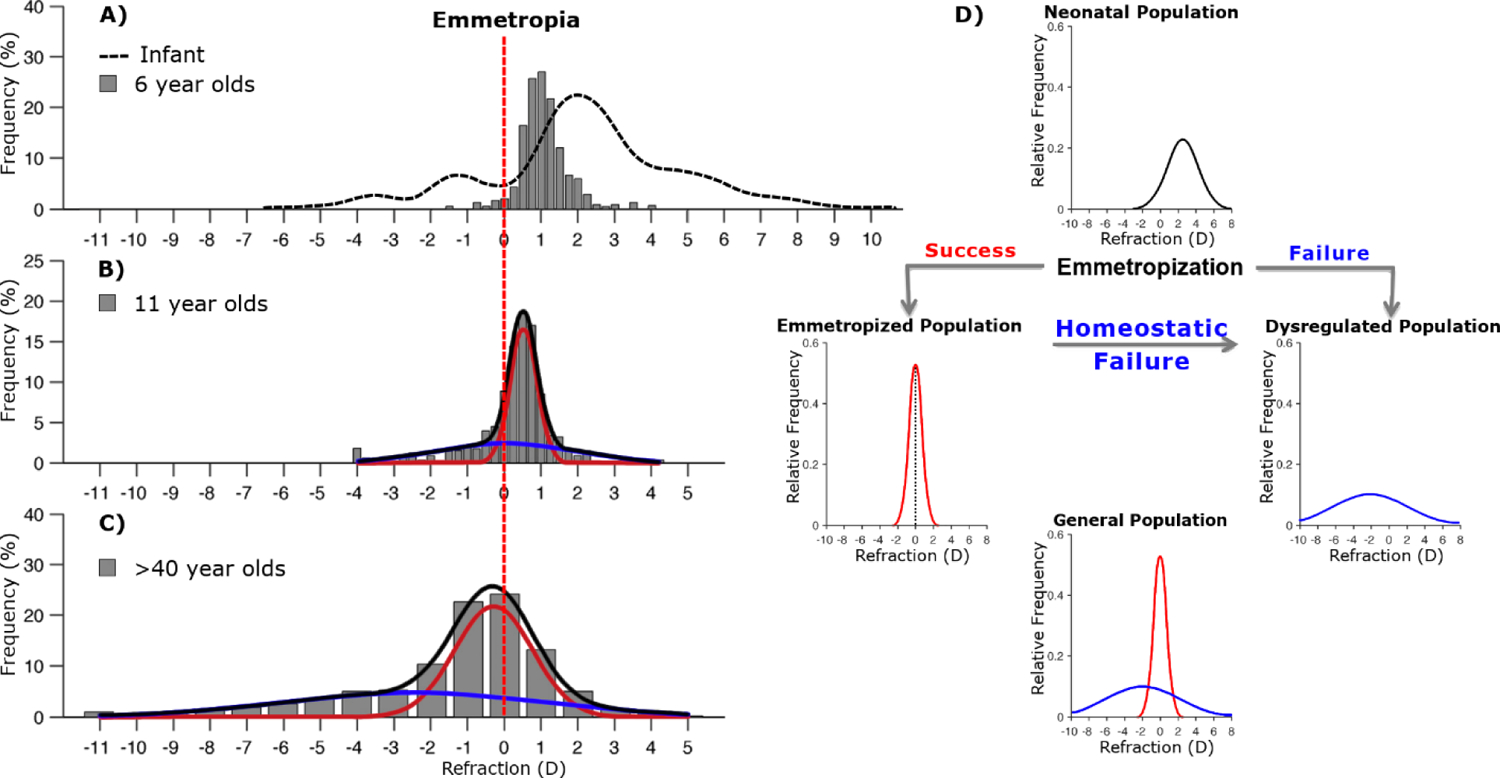
Figure 1:

(A-C) Real distributions of refractive errors in various populations. Vertical red dashed line indicates no refractive error. A) Infant populations show approximately Gaussian distributions of refractive error, the majority being hyperopic on average (dashed line). By age 6, emmetropization has reduced the variance. (B,C) As populations age, refractive errors become increasingly leptokurtic and can be well described by fitting two separate Gaussian distributions, representing properly emmetropized (red) and dysregulated (blue) populations. D) Hypothetical paths of refractive development. Dysregulated populations could be explained by a combination of failure to initially emmetropize (A), or failure maintain emmetropia (B,C). Modified from Flitcroft, 2013 and Chakraborty et al, 2020.
