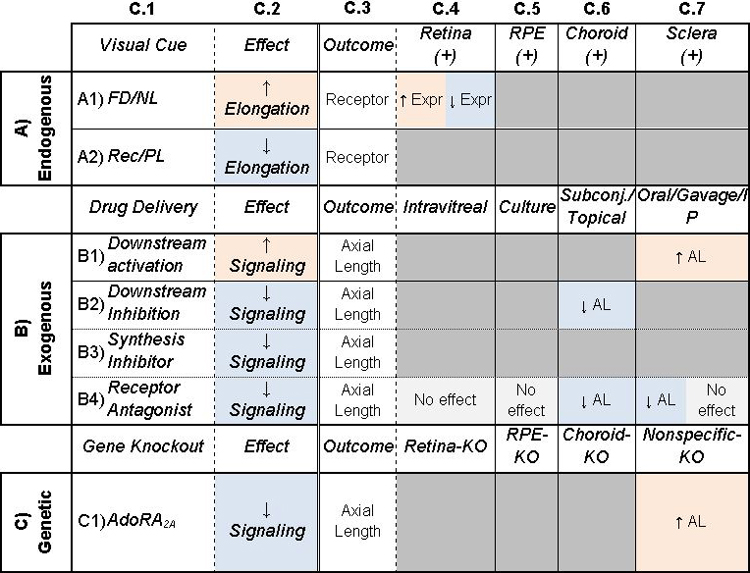
Table 3: Potential of adenosine to be a retinoscleral signal in refractive eye growth.
Column C.1: Treatments given to animals. C.2: General description of main effect of treatment. Columns C.3–7: Additional outcomes (C.3) studied with corresponding treatments. In A) Endogenous, C.4–7 are locations of measurements, and (+/−) represent whether receptors are expressed. In B) Exogenous and C) Genetic, C.4–7 are different locations of the treatment. Cells are shaded to highlight trends. Orange/blue shading indicate an increase/decrease in signaling or elongation. Gray indicates inconclusive or no effect. Table cells are split when studies came to different conclusions. AL: Axial Length, Expr: Expression, FD: Form-Deprivation, NL: Negative Lens, PL: Positive Lens, Rec: Recovery from myopia. See Supplemental Table 3 for associated references.

|
