Figure 3.
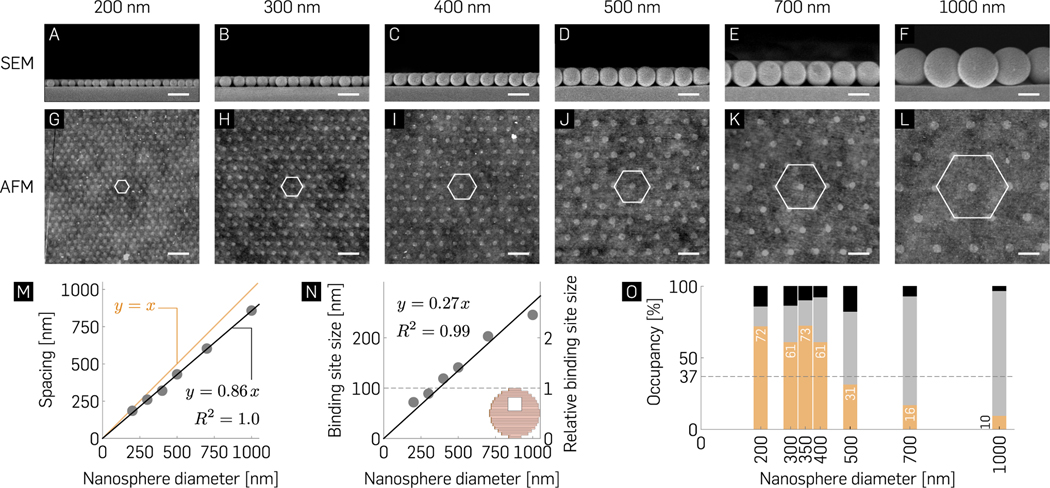
Nanosphere diameter-dependent occupancy statistics. (A–F) Cross-sectional EM images of hexagonal packing with indicated nanospheres reveal their mechanical contact with the glass surface and (G–L) their corresponding origami binding sites observed post lift-off via AFM imaging. Scale bars are 500 nm. (M, N) Spacing and binding site size of nanoarray patterning as a function of indicated nanosphere diameters. (inset) 100 nm circular origami for comparison. (O) Mean percentage binding of zero (black), exactly one (orange), and two or more origami (gray) as a function of nanosphere diameter (N ≥ 600) demonstrating non-Poisson statistics for single molecule binding with maximal 72.4 ± 2.14% and 72 ± 6.84% single origami binding for 350 and 200 nm nanospheres, respectively. The >70% measured probability for single origami binding is ~2× higher than the Poisson limit (horizontal dashed line and Figure S4). Refer to Table S4 for the ± SD of the mean percentage bindings.

