Fig. 1.

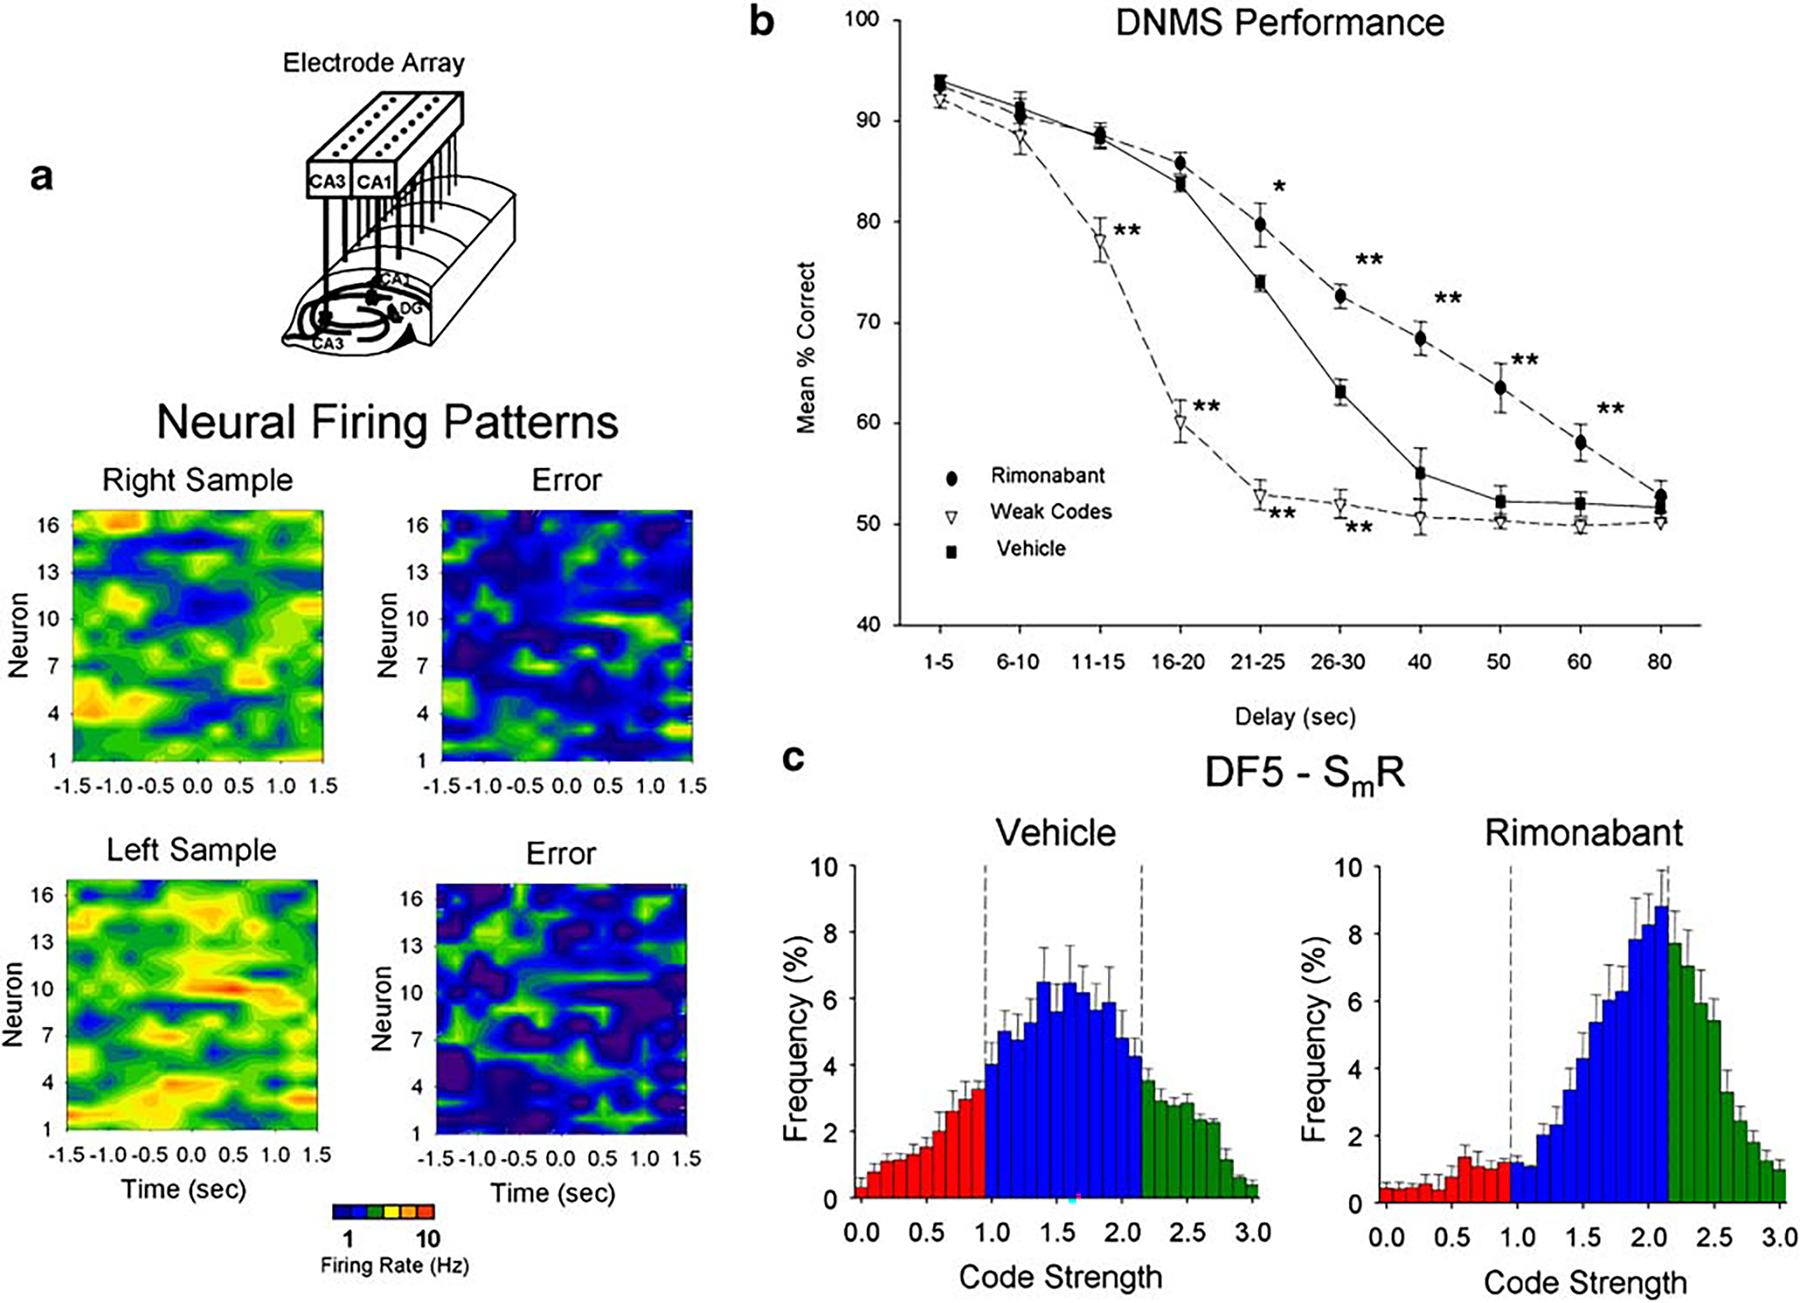
Hippocampal neural activity and performance of the delayed-non-match-to-sample (DNMS) task. a Ensemble firing patterns on single DNMS trials recorded from electrode arrays (illustrated at top) were analyzed by multivariate CDA. The discriminant function (DF5) that contributed to the sample response (SmR) yielded differential firing for correct and error trials plotted as perievent histograms (±1.5 s), represented here as color contours of firing rates across all neurons recorded in a single animal. Each of the four contour plots represents the firing pattern of the same ensemble on a different individual DNMS trial. Patterns in the left column illustrate “strong” encoding of right and left SmRs respectively, while patterns in the right column reflect “weak” encoding of SmRs resulting in behavioral errors. Individual neurons are listed (1–16) on vertical axis and time on the horizontal axis with “0.0 s” demarcating the occurrence of the SmR. The color scale depicts firing rate for contour plots: blue ≤1 Hz to red ≥10 Hz. b DNMS behavioral performance curves depicting mean (±SEM) percent correct responses on trials with delays of 1–80 s. Animals were trained with delays of 1–30 s and probe trials with delays of 40, 50, 60, or 80 s interspersed randomly to test strength of encoding. Mean correct performance in vehicle sessions (solid line), rimonabant sessions (dashed line and filled circles). Plot of weak code (DF5s < 0.90: performance) trials in vehicle sessions (dashed line and unfilled circles). *F(1,2514)>7.39, p<0.01; **F(1,2514)>13.69, p<0.001. c Frequency distribution of SmR code strengths (DF5 scores) for 40–80 s trials shown in B computed for all animals (n=13) across five to ten sessions ≥ 100 trials. Mean (±SEM) frequency (% of total trials) of occurrence of each of code strength (DF5 score bin=0.1, range 0–3.0) classified as weak (DF5=0–1.0, red), normal (1.0–2.0, blue), and strong (2.0–3.0, green) for vehicle (left) and rimonabant (right) sessions
