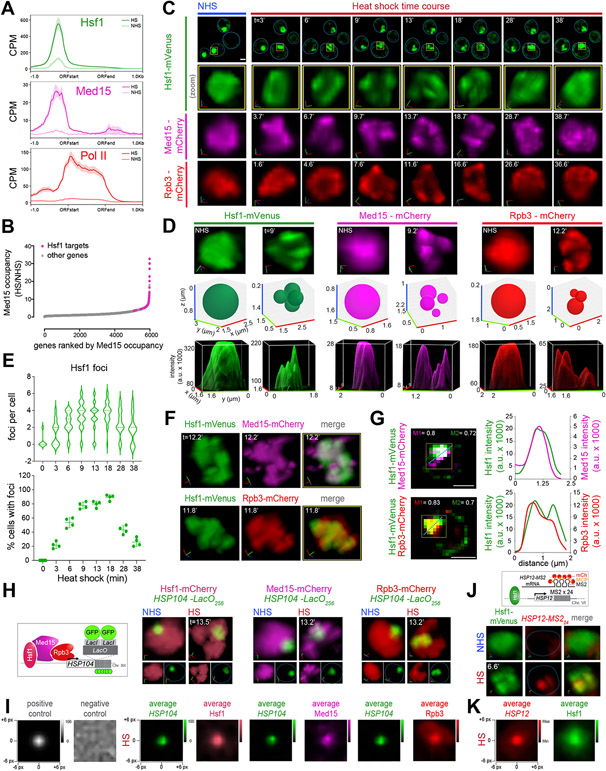
Figure 1. Hsf1, Mediator and RNA Pol II form transcriptionally active clusters at HSR genes upon heat shock.
A) Metagene plots of Hsf1 (top), Med15 (middle) and Pol II (Rpb1; bottom) normalized ChIP-seq reads of HSR genes. Shown are means +/− SE (shaded region). NHS, non-heat shock; HS, heat shock; CPM, counts per million reads.
B) Rank order of fold change in Med15 occupancy across Pol II-transcribed genes upon heat shock.
C) 4D imaging of single cells expressing Hsf1-mVenus, Med15-mCherry, or Rpb3-mCherry before (NHS, 24-26°C) and following HS (39°C) for the times (t) indicated. Row 1: images of cells expressing Hsf1-mVenus. Representative planes are shown. Blue line highlights cell boundary. Scale bar is 2 μm. Row 2: zoomed-in 3D volumetric rendering of the nucleus showing Hsf1-mVenus in one cell (yellow box in Row 1). x (red), y (green) and z (blue) axes are indicated. Rows 3 and 4: 3D volumetric renderings of the nuclei of a cell expressing either Med15-mCherry or Rpb3-mCherry.
D) Top row: 3D volumetric rendering as in C. Middle row: 3D bubble charts of Hsf1, Med15 and Rpb3 foci as detected by FindFoci for cells shown in the top row. Bottom row: 3D surface plots of signal intensity.
E) Top: number of Hsf1 foci per living cell quantified by automated analysis. Bottom: percentage of cells with >2 Hsf1 foci. 40-60 cells were evaluated per time point. Shown are means +/− SD.
F) Live imaging of cells co-expressing Hsf1-mVenus with Med15-mCherry (top) or Rpb3-mCherry (bottom).
G) Left: Quantification of colocalization of Hsf1 with Med15 and Rpb3 using Mander’s Overlay Coefficient. M1 indicates the fraction of mCherry that overlaps mVenus; M2, fraction overlap of mVenus with mCherry. Scale bar is 2 μm. Right: averaged intensity profiles along blue dotted lines as indicated in the images.
H) 3D rendered micrographs of Hsf1-mCherry, Med15-mCherry or Rpb3-mCherry and the HSP104-LacO256 gene locus. Blue dotted line highlights nuclear boundary.
I) Contour plots of Hsf1-mCherry, Med15-mCherry or Rpb3-mCherry showing averaged signal intensities centered at the HSP104-LacO256 gene locus 13 minutes following heat shock. Negative and positive controls were generated from simulation analysis of a random array or a 2D gaussian distribution, respectively.
J) Top: schematic of Hsf1 (green) and HSP12-MS224 mRNA (red). Bottom: 3D rendered micrographs of representative cells. Blue dotted line highlights nuclear boundary.
K) Contour plot of Hsf1-mVenus showing averaged intensity signal centered at HSP12-MS224 mRNA. Cells were imaged at 5 minutes of heat shock.
See also Figures S1-3.

