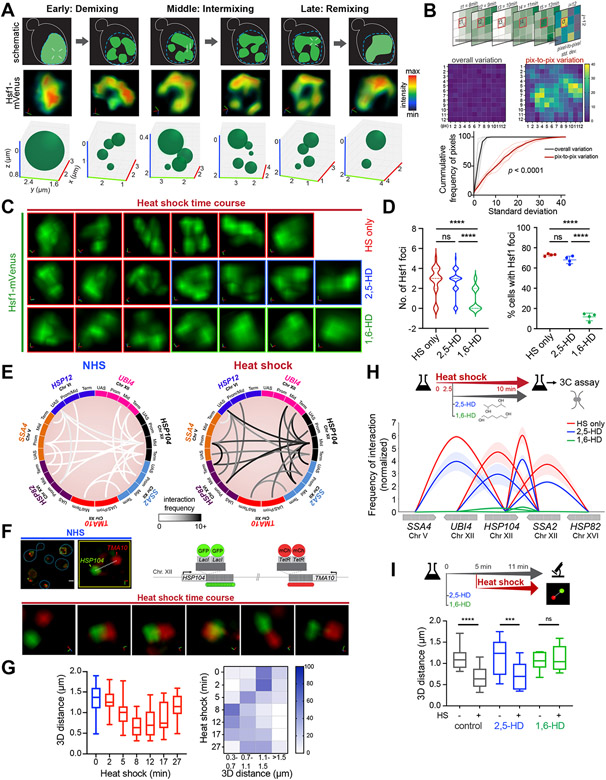
Figure 2. Hsf1 clusters are dynamic and associated with HSR gene coalescence.
A) Schematic (top), STED super-resolution imaging (middle) and 3D bubble plots (bottom) depicting Hsf1-mVenus foci dynamics at different stages of heat shock.
B) Top: schematic of the method used for computing variation of pixel intensity over time during the intermixing phase of heat shock. Middle: Heatmap of pixel variation in a representative nucleus against overall variation within the image. Bottom: Cumulative distribution of standard deviations for pixel-to-pixel (red) and overall (black) variation within six individual cells.
C) 3D rendered nuclei of representative cells subjected to heat shock alone or in the presence of either 2,5-HD or 1,6-HD. HD was added after 9 min of HS. Two different cells were imaged before and after HD treatment.
D) Number of Hsf1 foci per cell and the percentage of cells showing >2 Hsf1 foci in the conditions in C (n=110-140 cells/condition). Cells were imaged 3 minutes after adding HD. ****P <0.0001; ns (not significant), P >0.05. P values were calculated by ANOVA followed by Tukey’s post hoc analysis.
E) Circos plots depicting the two most frequent intergenic interactions between indicated gene pairs as determined by Taq I-3C derived from (Chowdhary et al., 2017; Chowdhary et al., 2019). Arc shades depict the frequencies of chromatin interactions between indicated regions.
F) 4D imaging of a diploid strain expressing HSP104-lacO256, TMA10-tetO200, LacI-GFP and TetR-mCherry (schematic, top right). Top left: micrographs of representative cells under NHS conditions (blue line highlights cell boundary) and an enlarged 3D view of the nuclear region indicated within the yellow box. Bottom: enlarged 3D micrographs of a representative cell subjected to heat shock. d, 3D distances measured between signal centroids.
G) Distribution of 3D distances between lacO-tagged HSP104 and tetO-tagged TMA10 gene loci in cells following heat shock (n=13 for NHS; n=20-30 for HS time points). Bottom: Heat map depicting percentage of cells with tagged gene loci within indicated 3D distances binned at intervals of 0.4 μm.
H) Intergenic contacts (solid arcs) between Hsf1 target gene pairs as determined by TaqI-3C in presence and absence of hexanediol. Genes are segmented as UAS, promoter, mid-ORF and terminator. Depicted are means +/− SD; n=2, qPCR=4.
I) Distribution of 3D distances between lacO-tagged HSP104 and tetO-tagged TMA10 under conditions as indicated. Cells were left untreated or pre-treated for 5 min with either 2,5- or 1,6-HD followed by no heat shock or heat shock for 6 min. n =13-22. ****P <0.0001; ***P <0.001; ns (not significant), P >0.05 (calculated using two-tail t test).
See also Figure S4.

