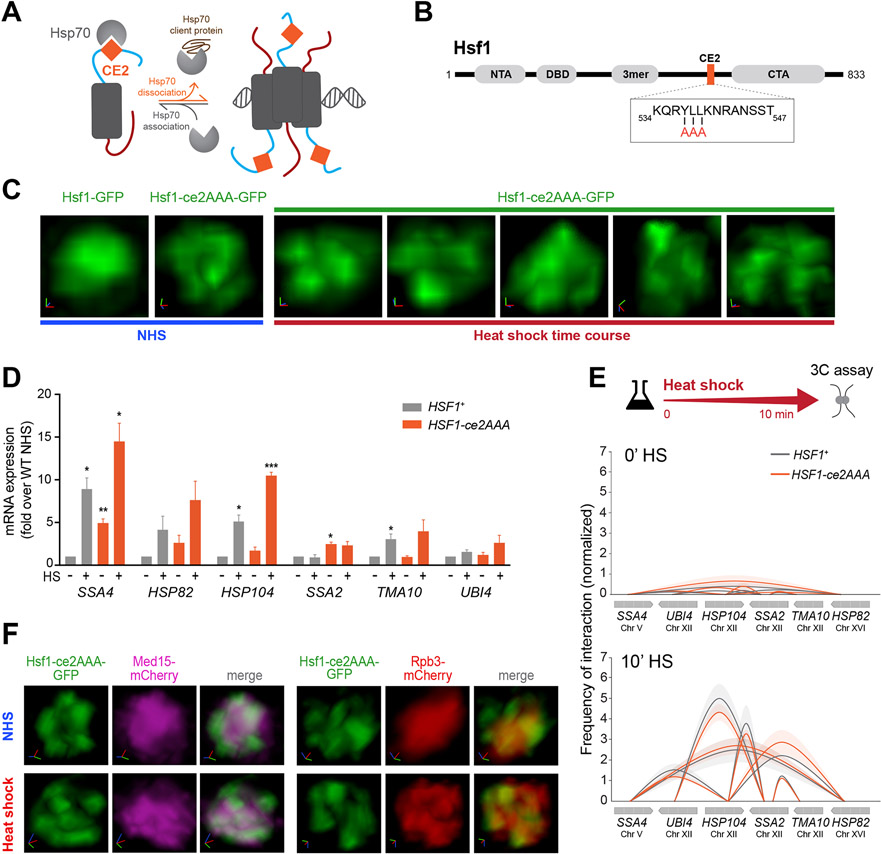
Figure 3. Hsp70 binding to Hsf1 represses cluster formation.
A) Schematic of the Hsp70 titration model of Hsf1 regulation. Hsp70 represses Hsf1 by binding to the CE2 domain. Sequestration of Hsp70 by its client proteins activates Hsf1.
B) Domain map of Hsf1. NTA, N-terminal activation domain; DBD, DNA binding domain; 3mer, trimerization domain; CE2, conserved element 2 domain (orange); CTA, C-terminal activation domain. Box: CE2 sequence and alanine substitutions in the Hsf1-ce2AAA mutant.
C) 3D rendered images of wild type and Hsf1-ce2AAA mutant cells.
D) mRNA expression measured by RT-qPCR of representative Hsf1-regulated genes in HSF1+ and HSF1-ce2AAA strains under NHS and 10 min-HS conditions. ***P <0.001; **P <0.01; *P <0.05 (calculated using multiple unpaired t tests).
E) Intergenic contacts between indicated Hsf1 target gene pairs determined by TaqI-3C.
F) Live imaging of cells co-expressing Hsf1 ce2AAA-GFP with Med15-mCherry or Rpb3-mCherry.

