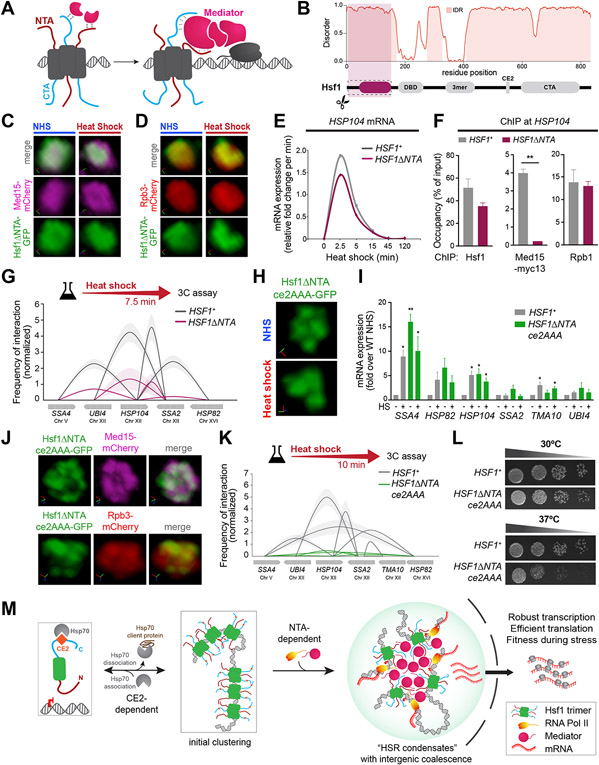
Figure 4. HSR condensates drive inducible intergenic coalescence by the combined actions of the CE2 and NTA regions of Hsf1.
A) Cartoon depiction of Mediator recruitment via dual Hsf1 activation domains.
B) Domain map and prediction of disorder in Hsf1 by Metapredict V2 (Emenecker et al., 2022).
C) Live imaging of Hsf1ΔNTA -GFP and Med15-mCherry.
D) Live imaging of Hsf1ΔNTA -GFP and Rpb3-mCherry.
E) Transcription rates of HSP104 in HSF1+ and HSF1-ΔNTA deduced from RT-qPCR.
F) Hsf1 and Med15-myc13 ChIP at the UASs and Rpb1 ChIP at the promoter region of HSP104 in wild type and Hsf1-ΔNTA strains heat-shocked for 7.5 min. Depicted are means + SD. **, P <0.01 (calculated using two-tail t-test).
G) Intergenic contacts between indicated Hsf1 target gene pairs in 7.5 min-HS conditions as determined by TaqI-3C.
H) Representative 3D rendering of Hsf1-GFP and Hsf1-ΔNTA-ce2AAA-GFP.
I) mRNA expression measured by RT-qPCR of representative Hsf1-regulated genes in HSF1+ and HSF1-ΔNTAce2AAA strains under NHS and 10 min-HS conditions. **P <0.01; *P <0.05 (calculated using multiple unpaired t tests)
J) Live imaging of cells co-expressing Hsf1ΔNTAce2AAA -GFP with Med15-mCherry or Rpb3-mCherry under NHS conditions.
K) Intergenic contacts) between indicated Hsf1 target gene pairs following 10 min-HS conditions as determined by TaqI-3C.
L) Spot dilution analysis of HSF1+ and HSF1-ΔNTAce2AAA cells. Plates were incubated at 30°C or 37°C for 30 h.
M) Schematic depiction of HSR condensate formation.

