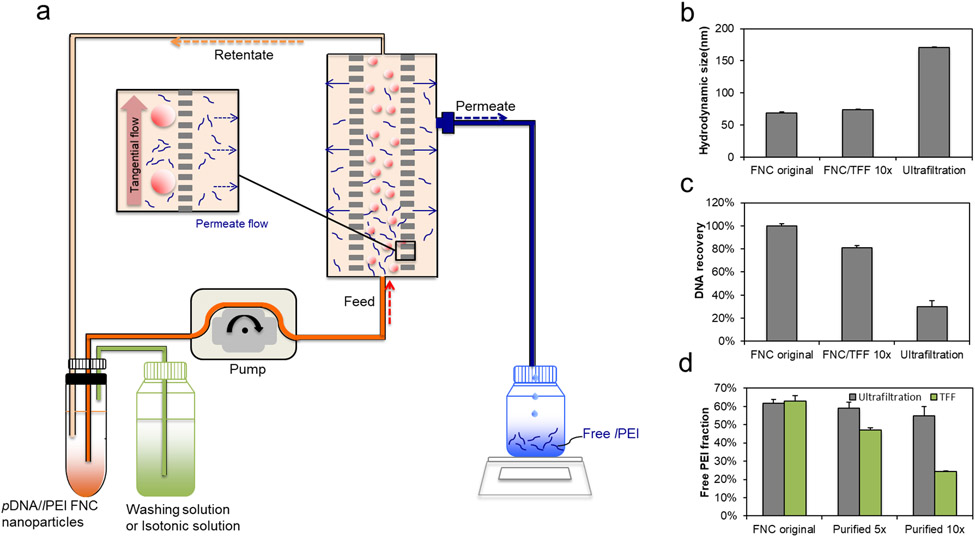
Figure 1.
(a) Schematic diagram of pDNA/lPEI nanoparticle purification by TFF. Comparison of (b) the z-average hydrodynamic size (c) DNA recovery and (d) free lPEI fraction of the nanoparticles before purification (FNC original nanoparticles) vs. following purification by TFF and ultrafiltration methods using the 5-volume washing (5×) and 10-volume washing (10×) protocols, respectively (n = 3). The 5× and 10× washing refer to 5 and 10 times of the volume of the solvent used, respectively, in reference to the volume of nanoparticles. This is measured by the volume of the permeate collected during the TFF process.

