Figure 2.
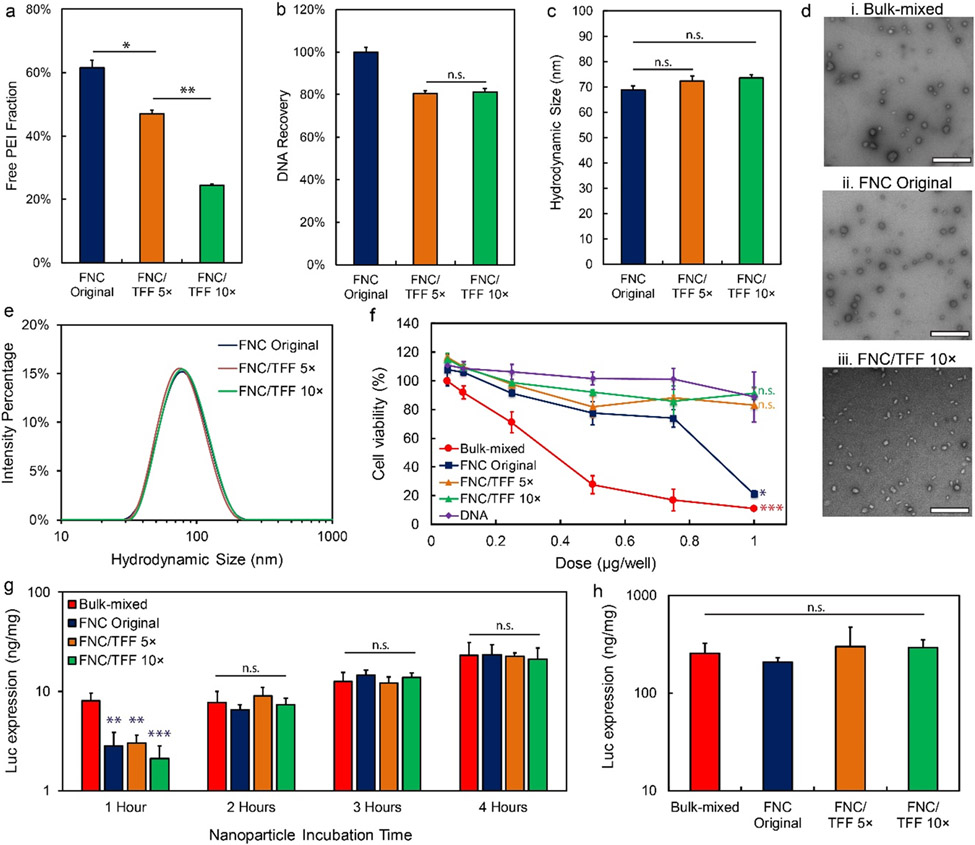
The pDNA/lPEI nanoparticle characteristics and in vitro transfection activities after TFF purification with optimized conditions. (a) Percentage of the free lPEI, (b) DNA recovery, and (c) z-average size of the nanoparticles before and after TFF purification; FNC/TFF 5× and FNC/TFF 10× (see Fig. 1 for group description). (d) TEM images of the nanoparticles prepared by (i) bulk-mixed: Polyplus protocol (ii) FNC original (unpurified), and (iii) FNC/TFF 10×. Scale bar is 500 nm. (e) The intensity average size distribution of the nanoparticles before and after TFF. (f) In vitro cellular viability of PC3 cell line in bulk-mixed: Polyplus protocol, FNC original, FNC/TFF 5×, FNC/TFF 10× nanoparticles and naked DNA with different DNA concentrations (nanoparticle concentration was titrated to match the DNA concentration for comparison purpose). For statistical analysis, the comparison is against DNA group and bulk-mixed group, respectively. (g) In vitro transfection efficiency with different incubation time of bulk-mixed: Polyplus protocol, FNC original, FNC/TFF 5×, FNC/TFF 10× purified pDNA/lPEI nanoparticles by PC3 cell line. (h) In vitro transfection efficiency of bulk-mixed: Polyplus protocol, FNC original, FNC/TFF 5×, FNC/TFF 10× purified nanoparticles by NCI-H1299 cell line. For statistical analysis, n.s. denotes no statistical significance with p > 0.05, *p < 0.05, **p < 0.01, and ***p < 0.001 from one-way ANOVA test.

