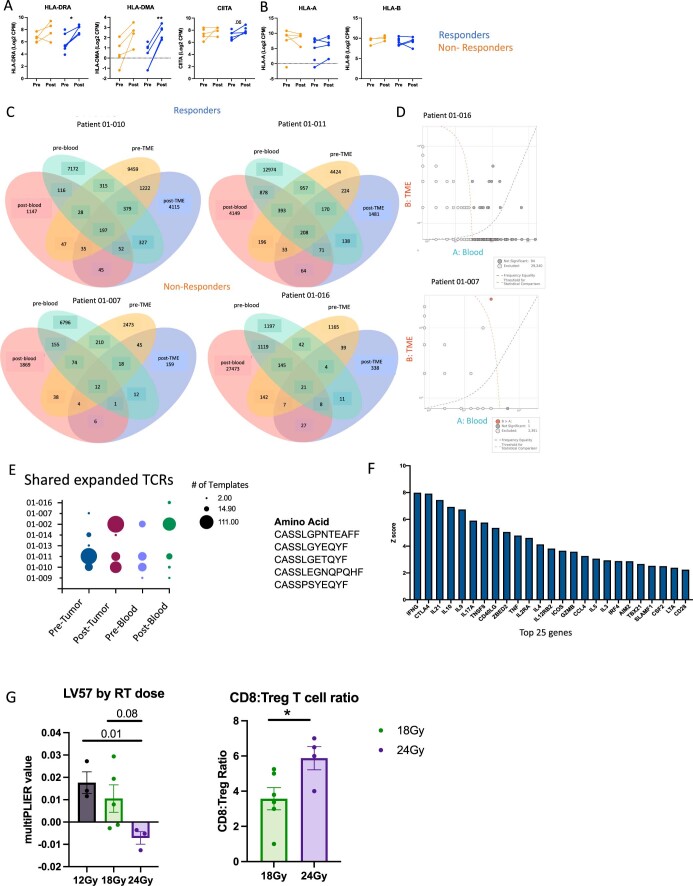
Extended Data Fig. 5. Antigen presentation is increased in responders while Tregs are decreased.
(A) RNA expression of genes associated with MHC II expression (CIITA) and MHC II genes (HLA-DRA and HLA-DMA) (non-responders n = 5 patients, responders n = 8 patients) (HLA-DRA non-responders p = 0.25 and responders p = 0.02; HLA-DMA non-responders p = 0.07 and responders p = 0.0014; CIITA non-responders p = 0.19 and responders p = 0.06). (B) RNA expression of MHC I genes (HLA-A and HLA-B) (non-responders n = 5 patients, responders n = 8 patients). (C) Venn diagrams depicting TCR sequences shared between the blood and the TME pre- and post-treatment in representative responders and non-responders (non-responders n = 3 patients, responders n = 5 patients). (D) Scatterplot with annotations depicting clones with more than 8 transcripts after treatment in the TME and blood for patients 01-016 and 01-007. Light grey dots were not included in the analysis because they had less than 8 sequences. Dark grey dots are clones that were not significantly different between post-treatment TME and blood samples. Red dots were clones significantly increased the TME and blue dots were clones that were significantly increased in the blood. Dots along the Y and X axis are clones not present in the TME or blood post-treatment, respectively. (E) Dot plot of template expansion of the top 5 TCR amino acid sequences shared between the most samples. Any patient sample was required to have at least two templates to be included. The top 5 amino acid sequences found are on the right. Analysis was conducted using the ImmunoSEQ analyzer. (F) Top 25 genes for LV57 identified by MultiPLIER (non-responders n = 5 patients, responders n = 8 patients). (G) Quantification of LV57 by dose of RT (12 Gy n = 3 patients, 18 Gy n = 5 patients, 24 Gy n = 3 patients) and quantification of the CD8:Treg Ratio in tumor samples post-treatment by VECTRA (p = 0.04) (18 Gy n = 5 patients, 24 Gy n = 4 patients). Statistical significance was determined using a two-tailed unpaired student’s t-test, *p < 0.05 and **p < 0.01. The error bars represent the standard error of the mean (± SEM).

