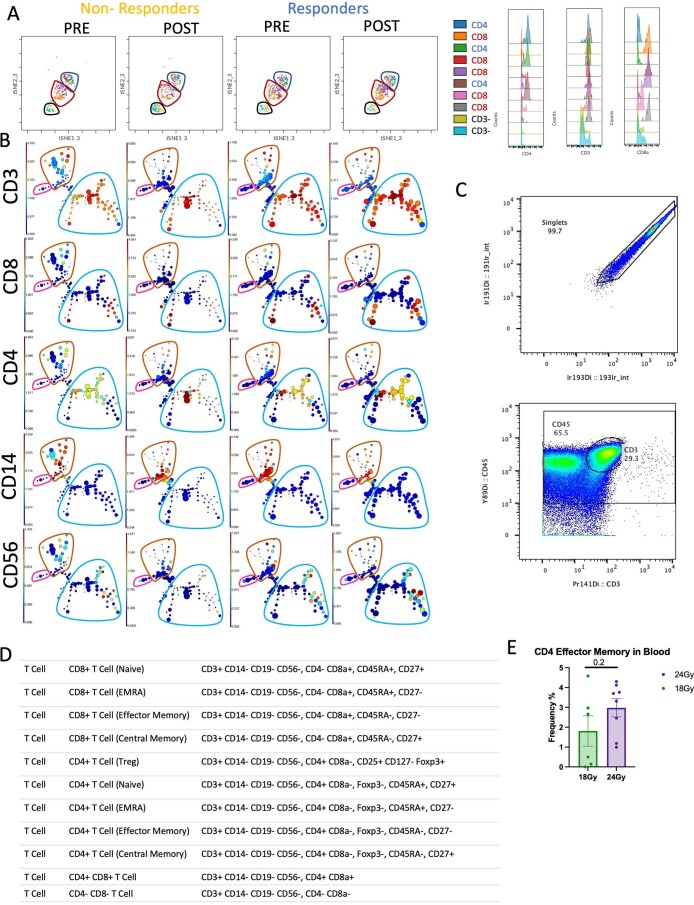
Extended Data Fig. 6. Clustering of cell populations in the blood.
(A) Defining CD4+ and CD8+ T cells withing the activated T cell cluster (non-responders n = 3 patients, responders n = 9 patients). (B) CITRUS populations identified using differentiating markers (CD3, CD4, CD8, CD14, CD56). (C) Gating strategy for CD45+ cells used for clustering analysis. (D) Gating strategy for memory T cells. (E) Quantification of Effector Memory CD4 T cells post treatment by dose of radiation, at time of surgery (18 Gy n = 6 patients, 24 Gy n = 8 patients). Statistical significance was determined using a two-tailed unpaired student’s t-test. The error bars represent the standard error of the mean (± SEM).

