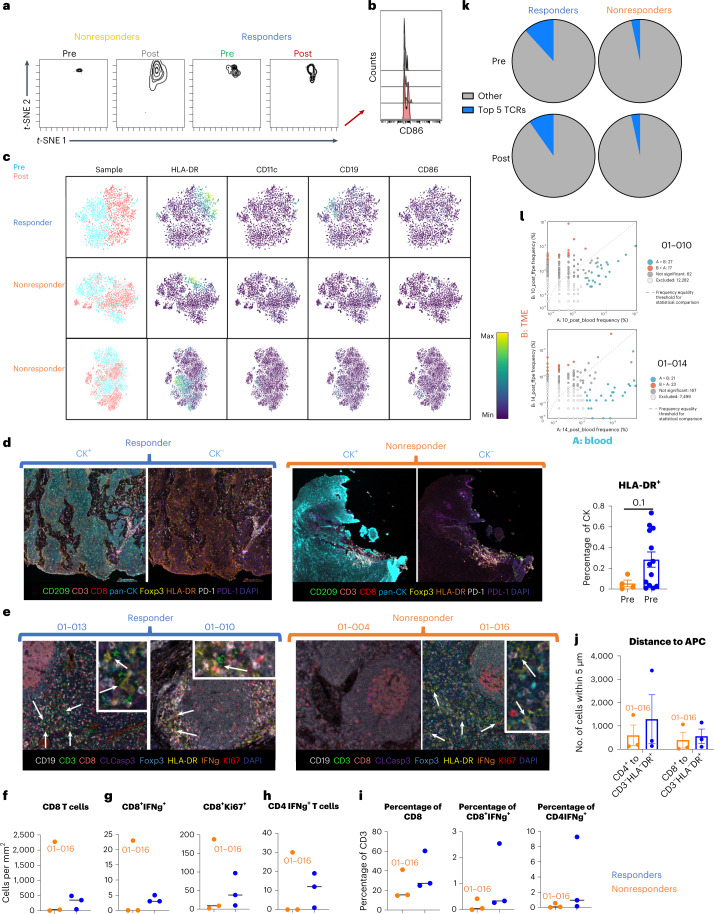
Fig. 3. Responders increase antigen presentation and TCR expansion.
a, Density plots of the antigen-presenting cluster from Fig. 2a (nonresponders n = 6 patients, responders n = 10 patients). b, Histogram representing the amount of CD86 expressed by cells within the antigen-presenting cluster. c, t-SNEs of CD45+ cells in a responder and two nonresponders. Blue represents TME samples taken before treatment, and pink represents TME samples taken after treatment. d, Left, representative VECTRA images of HLA-DR expression (left images with CK expression, right images without CK expression). Right, quantification of VECTRA images of HLA-DR expression on CK+ cells within the TME pre-treatment (mean ± s.e.m.) (nonresponders n = 4 patients, responders n = 12 patients). e, Representative VECTRA images of DLNs collected at time of surgery. DC–T cell interactions are highlighted with white arrows. f, Density of CD8+ T cells (CD3+CD8+) in the DLNs (nonresponders n = 3 patients, responders n = 3 patients). g, Density of activated CD8+ T cells (CD3+CD8+IFN-γ+) and replicating CD8+ T cells (CD3+CD8+Ki67+) in the DLNs (nonresponders n = 3 patients, responders n = 3 patients). h, Density of activated CD4+ T cells (CD3+CD8−Foxp3−IFN-γ+) in the DLNs (nonresponders n = 3 patients, responders n = 3 patients). i, Percentages of CD3+ cells that are CD8+ T cells, activated CD8+ T cells and activated CD4+ T cells (nonresponders n = 3 patients, responders n = 3 patients). j, Quantification of how many T cells were within 15 μm of APCs (CD3−HLA−DR+) (mean ± s.e.m.) (nonresponders n = 3 patients, responders n = 3 patients). k, Average of the top 5 TCR sequences pre- and post-treatment in the blood (nonresponders n = 3 patients, responders n = 5 patients). l, Scatterplot with annotations depicting clones with more than 8 transcripts after treatment in the TME and blood for patients 01-010 and 01-014. Red dots are clones significantly increased in the TME and blue dots are clones that were significantly increased in the blood. Dots along the y and x axes are clones not present in the TME or blood post-treatment, respectively. Statistical significance was determined using a two-tailed paired Student’s t-test. *P < 0.05, **P < 0.01, ***P < 0.001.

