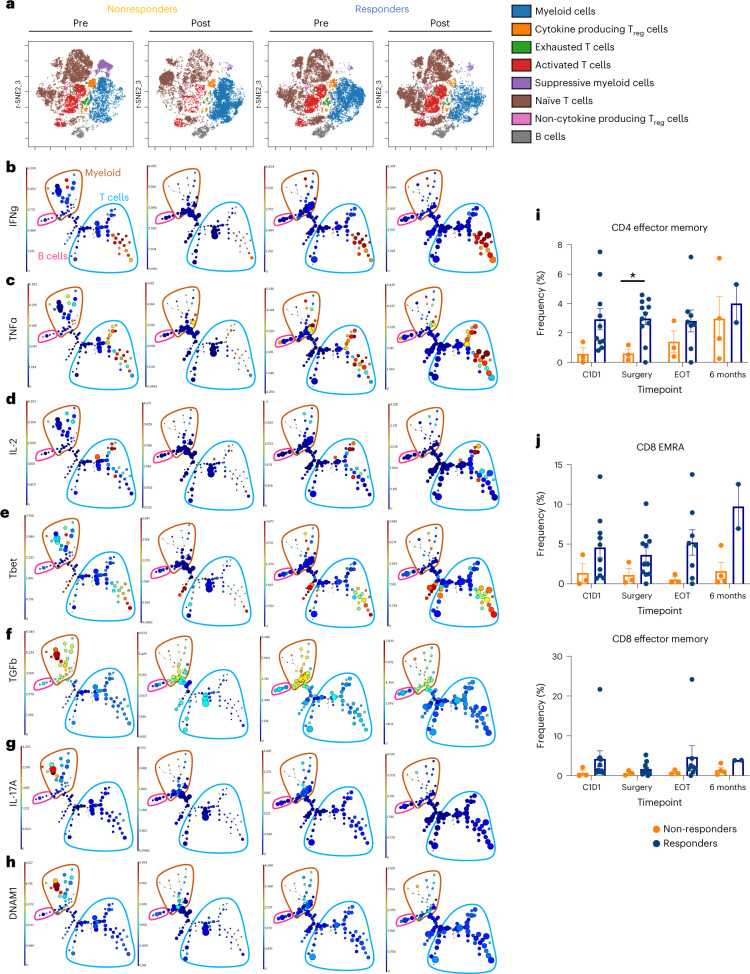
Fig. 5. Circulating lymphocytes and metabolites correlate with response.
a, viSNE depicting cell populations identified in the blood (nonresponders n = 3 patients, responders n = 9 patients). b, Expression of IFN-γ, c, TNF-α, d, IL-2, e, Tbet, f, TGF-β, g, IL-17A and h, DNAM in different populations in the blood. B cells are in pink, T cells are in blue and myeloids are in brown. i, Quantification of CD4+ effector memory T cells (CD3+CD19−CD56−CD14−CD4+CD8−Foxp3−CD45RA−CD27−) at baseline, time of surgery, EOT and 6-month follow-up (mean ± s.e.m.). C1D1 P = 0.57, surgery P = 0.016 and EOT P = 0.31. j, CD8+ EMRA T cells (CD3+CD19−CD56−CD14−CD4−CD8+CD45RA+, CD27−) (C1D1 P = 0.22, surgery P = 0.18, EOT P = 0.12 and 6-month follow-up P = 0.026) and CD8+ effector memory T cells (CD3+CD19−CD56−CD14−CD4−CD8+CD45RA−, CD27−) (C1D1 P = 0.37, surgery P = 0.28 and EOT P = 0.44) at baseline, time of surgery, EOT and 6-month follow-up (mean ± s.e.m.). For blood analysis at various time points in both i and j, C1D1 (nonresponders n = 3 patients, responders n = 10 patients), surgery (nonresponders n = 3 patients, responders n = 11 patients), EOT (nonresponders n = 3 patients, responders n = 8 patients) and for 6-month follow-up (nonresponders n = 4 patients, responders n = 2 patients). A two-tailed Student’s t-test was used to determine statistical significance, *P < 0.05.

