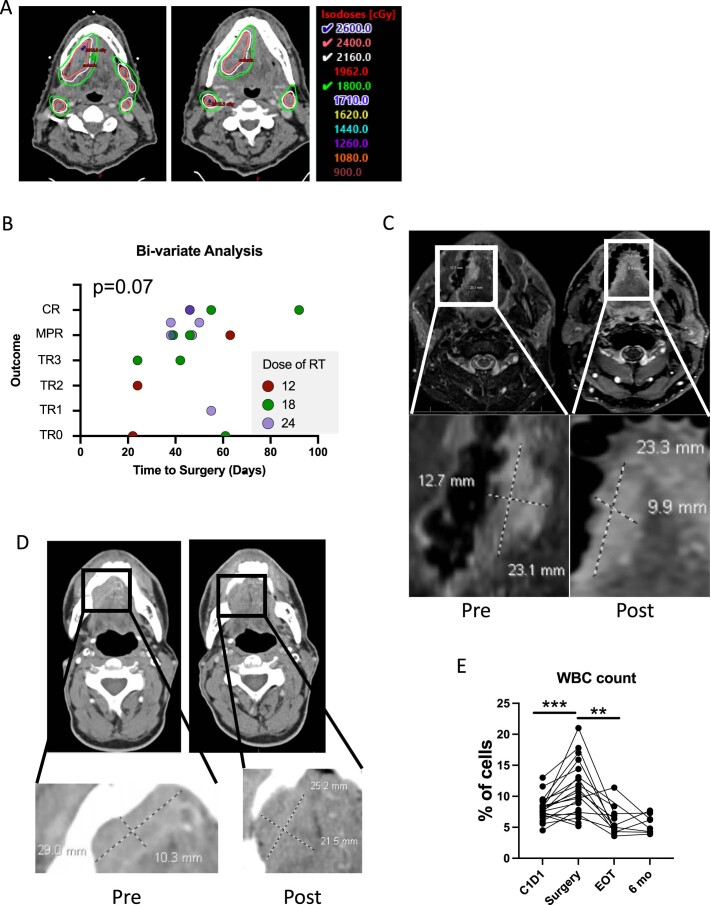
Extended Data Fig. 1. Representative images of SBRT planning and response to treatment.
(A) Representative image of volumetric contouring of gross tumor only to determine the specific doses of SBRT delivered. (B) A multiple logistic regression analysis was used to determine if time to surgery or dose of radiation can independently account for pathological response at time of surgery (n = 19 patients). P = 0.07 (coefficient estimate per Gy of RT = 0.2253, s.e.m. = 0.1429, CI (−0.03648,0.5582); intercept for the logistic regression was −6.207). (C) Representative MRI of a patient pre- and post-treatment with tumor volume measurements magnified. (D) Representative CT image of a patient pre- and post-treatment with tumor volume measurements magnified. (E) White blood cell (WBC) count for each patient at four time points (C1D1, surgery, end of treatment (EOT) and 6-month follow-up). C1D1 n = 21 patients, surgery n = 20 patients, EOT n = 12 patients and 6-month follow-up n = 8 patients (P = 0.0006*** and P = 0.0019**). A multiple linear regression test was used to determine interdependence of time to surgery and dose of radiation for B. Statistical significance was determined by a paired two-sided Student’s t-test for E. Significance was concluded if P<0.05 (*P<0.05, **P<0.01, ***P<0.001). These are representative images of 21 patients.

