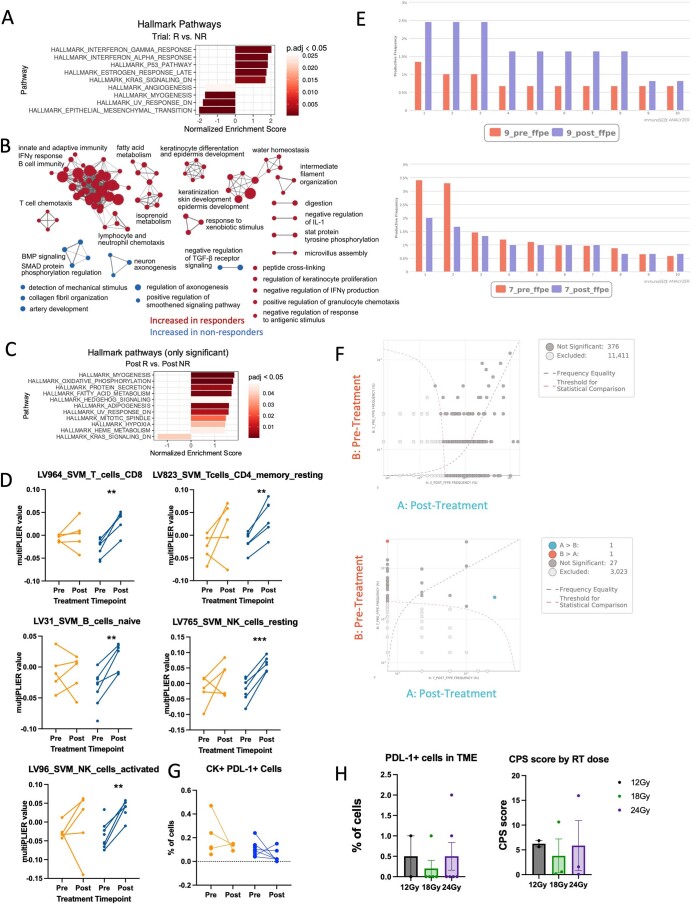
Extended Data Fig. 3. Responders have an increase in genes and pathways associated with inflammation.
(A) Significant HALLMARK pathways that differed between responders and non-responders at baseline (non-responders n = 5 patients, responders n = 8 patients). (B) Gene mapping analysis of significant pathways increased in responders and non-responders at baseline using significant genes identified in GO biological and KEGG pathway analysis. Red clusters are increased in responders at baseline and blue clusters are increased in non-responders at baseline (non-responders n = 5 patients, responders n = 8 patients). (C) Significant HALLMARK pathways that differed between responders and non-responders post-treatment (non-responders n = 5 patients, responders n = 8 patients). (D) MultiPLIER cell type analysis of the RNA sequencing data (non-responders n = 5 patients, responders n = 8 patients) (LV964 non-responders p = 0.63 and responders p = 0.0024; LV823 non-responders p = 0.07 and responders p = 0.0059; LV31 non-responders p = 0.88 and responders p = 0.007; LV765 non-responders p = 0.28 and responders p = 0.001; LV96 non-responders p = 0.59 and responders = 0.0025). (E) Representative graphs depicting TCR clone expansion of the top 10 clones for two patients, a responder (01-009) and a non-responder (01-007). (F) Scatterplot with annotations depicting clones with more than 8 transcripts before and after treatment for patients 01-002 and 01-007. Light grey dots were not included in the analysis because they had less than 8 sequences. Dark grey dots are clones that were not significantly different between pre- and post-samples. Red dots were clones significantly increased pre-treatment and blue dots were clones that were significantly increased post-treatment. Dots along the Y and X axis are clones not present in the pre-sample or post-sample, respectively. Analysis was conducted using the ImmunoSEQ analyzer. (G) Quantification of PD-L1 expressing cancer cells (CK+) within the TME pre- and post-treatment (non-responders n = 6 patients, responders n = 12 patients). Non-responders p = 0.36 and responders p = 0.26. (H) Quantification of CPS score (12 Gy n = 2 patients, 18 Gy n = 3 patients, and 24 Gy n = 3 patients) and PD-L1+ cells (12 Gy n = 2 patients, 18 Gy n = 5 patients, 24 Gy n = 6 patients) in the TME post-treatment by VECTRA categorized by dose of SBRT given to the patient. Significance was determined by a two-way paired student’s t-test, *p < 0.05, **p < 0.01, and ***p < 0.001. The error bars represent the standard error of the mean (± SEM).

