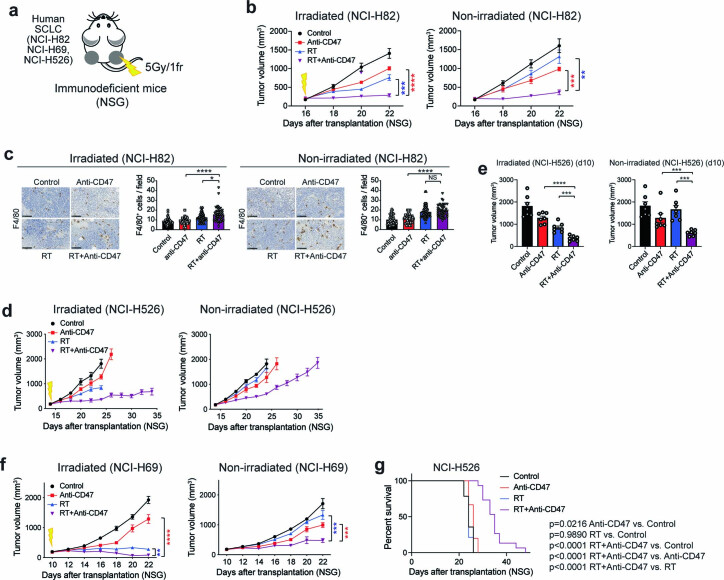
Extended Data Fig. 4. T-cell independent abscopal effects upon radiation therapy and CD47 blockade in human SCLC models.
a. Human SCLC cells were engrafted into both flanks of NSG mice and only right-side tumors were irradiated. b, d, f, Growth curves of xenografts with the indicated treatments. b. NCI-H82: N = 1 experiment with n = 4 (Control, Anti-CD47) or 5 (RT, RT + Anti-CD47) mice. Irradiated tumors: ****p < 0.0001, ***p = 0.0007, non-irradiated tumors: ***p = 0.0002, **p = 0.0010. c. Histological analysis and quantification of macrophages tumors as in (b) by immunostaining for F4/80. Sections were counterstained with hematoxylin. Each symbol represents one field quantified. Scale bar, 100 µm. Irradiated tumors: *p = 0.0282, ****p < 0.0001, non-irradiated tumors: ****p < 0.0001. d. NCI-H526: N = 1 experiment with n = 7 mice per condition. e. Quantification of tumor volume 10 days after radiation in irradiated and non-irradiated control tumors in (d). N = 1 experiment with n = 7 mice per condition. Irradiated tumors: ****p < 0.0001, ***p = 0.0002, non-irradiated tumors: ***0.0006, ***p = 0.0006. f. NCI-H69: N = 1 experiment with n = 7 (Control, Anti-CD47, RT) or 8 (RT + Anti-CD47) mice per condition. Irradiated tumors: ****p < 0.0001, **p = 0.0064, non-irradiated tumors: ***p = 0.0004, ***p = 0.0002. g. Survival curves of NCI-H526 xenografts with the indicated treatments: N = 1 experiment with n = 14 (Control, RT) or n = 15 (Anti-CD47, RT + Anti-CD47) mice. Two-tailed t-tests following two-way ANOVA were performed in (b) (irradiated tumors: p < 0.0001, non-irradiated tumors: p < 0.0001), and (f) (irradiated tumors: p < 0.0001, non-irradiated tumors: p < 0.0001). Two-tailed t-tests following one-way ANOVA were performed in (c) (irradiated tumors: p < 0.0001, non-irradiated tumors: p < 0.0001) and (d) (irradiated tumors: p < 0.0001, non-irradiated tumors: p = 0.0002). Survival curves were compared using the Log-rank test in (g). Error bars represent SEM. *p < 0.05, **p < 0.01, ***p < 0.001, ****p < 0.0001.

