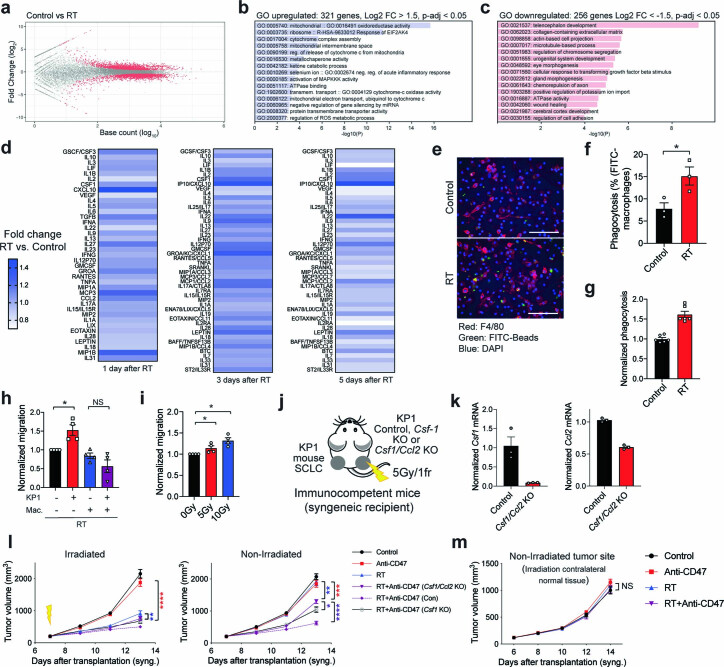
Extended Data Fig. 7. Irradiation of SCLC cells in culture results in the secretion of inflammatory cytokines and enhances the phagocytosis and the migration ability of macrophages.
a. SCLC cells were collected 24 hours after irradiation (N = 1 experiment with 2 controls and 3 irradiated samples) and analyzed by bulk RNA sequencing (RNA-seq). Differentially expressed genes were obtained using DESeq2 using IHW for p value correction. Genes in red in the MA plot have a p-adjusted value < 0.05. b. GO of upregulated genes. c. GO of downregulated genes. See also Supplementary Tables 3, 4. d. Cytokine array with conditioned medium harvested from irradiated and control KP1 mouse SCLC cells. N = 1 experiment for each time point (the average of technical triplicates is shown). A different array was used for day 1 versus days 3 and 5. See also Supplementary Table 5. e. Representative immunofluorescence image of an in vitro phagocytosis assay with mouse bone marrow-derived macrophages (BMDMs) marked by F4/80 (red) and beads conjugated with FITC (green). The supernatant of irradiated KP1 cells was compared to non-irradiated cells. DAPI stains the DNA in blue. Scale bar, 100 μm. f. Quantification of (e). N = 1 experiment with triplicates. p = 0.0381. g. Flow cytometry analysis of an in vitro phagocytosis assay with BMDMs and KP3 mouse SCLC cells labeled with Calcein AM. N = 1 experiment with 6 technical replicates. h. Normalized migration ability of irradiated and control BMDMs (Mac.) cultured with conditioned medium of irradiated or control KP1 cells. N = 4 independent experiments with 2–3 replicates per experiment. *p = 0.0286. i. Normalized migration ability of BMDMs cultured with conditioned medium of irradiated (two doses) and control KP1 cells. N = 4 independent experiments with triplicates. *p = 0.0286, *p = 0.0286. j. Mouse KP1 control, Csf1 knockout (KO) (see Fig. 5d–g), or Csf1/Ccl2 KO SCLC cells were engrafted into the right flank of recipient mice, with control KP1 cells on the left flank. Only right-side of tumors were irradiated. k. Relative mRNA level by RT–qPCR for Csf1 and Ccl2 in Control and Csf1/Ccl2 KO cells (n = 3 technical replicates). l. Growth curves of KP1 allografts as in (j) at the irradiated and non-irradiated sites. N = 1 experiment with n = 7 (RT + Anti-CD47 (Con) and RT + Anti-CD47 (Csf1 KO)), 8 (Anti-CD47), or 9 (Control, RT, and RT + Anti-CD47 (Csf1/Ccl2 KO) mice. Irradiated tumors: ****p < 0.0001, **p = 0.0049, non-irradiated tumors: ***p = 0.0006, **p = 0.0013, *p = 0.0281, ****p < 0.0001. m. KP1 cells were engrafted into the left flank of recipient mice. Only right-side of flanks (no tumors) were irradiated. Growth curves of KP1 allografts at the non-irradiated site. N = 1 experiment with n = 6 (Control, Anti-CD47) or n = 7 (RT, RT + Anti-CD47) mice. Two-tailed unpaired t-tests were performed on technical replicates in (f) and (g) with primary BMDM cultures. Two-tailed t-tests following one-way ANOVA were performed in (h) (p = 0.0006) and (i) (p = 0.0038). Two-tailed t-tests following two-way ANOVA were performed in (l) ((irradiated tumors: p < 0.0001, non-irradiated tumors: p < 0.0001) and (m) (p = 0.3077). Error bars represent SEM. *p < 0.05, **p < 0.01, ***p < 0.001, ****p < 0.0001.

