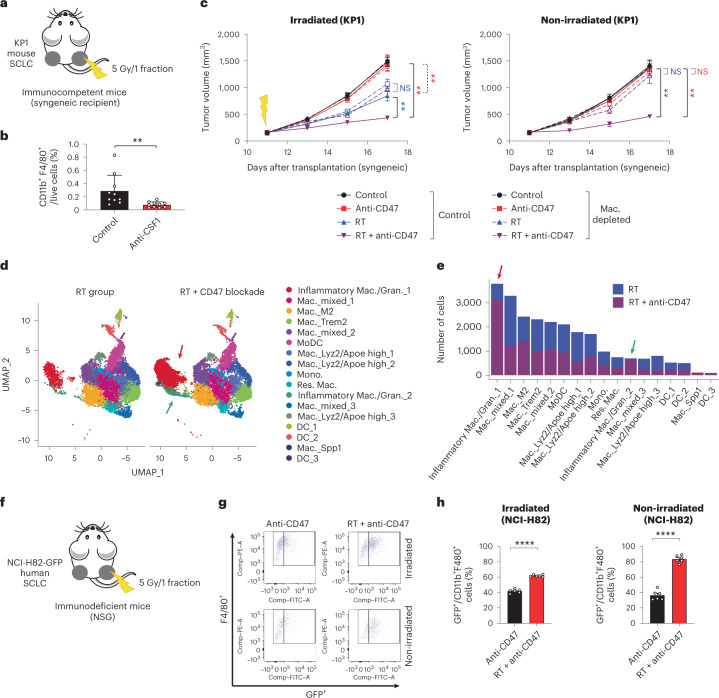
Fig. 4. Inflammatory macrophages mediate abscopal effects induced by radiotherapy and CD47 blockade.
a, Mouse KP1 SCLC cells were engrafted into both flanks of B6129SF1 immunocompetent syngeneic mice and only right-side tumors were irradiated. b, Macrophages were depleted using an anti-CSF1 antibody, as quantified by flow cytometry (CD11b+F4/80+ cells) from the tumors of mice in the control group with or without anti-CSF1 antibody on day 17. n = 1 experiment with n = 5 mice (two tumors per mouse), P = 0.0010. c, Growth curves of KP1 SCLC allografts as in a,b with the indicated treatments. n = 1 experiment with n = 5 mice (two tumors per mouse). Irradiated tumors, **P = 0.0079, **P = 0.0011, **P = 0.0038; non-irradiated tumors, **P = 0.0079, **P = 0.0079. NS, not significant; Mac., macrophages. d, Uniform Manifold Approximation and Projection (UMAP) dimension 1 and 2 plots of viable CD45+ cells in non-irradiated KP1 tumors in NSG mice in the RT and RT/CD47-blockade treatment groups. Cell clusters are colored by cell populations. Colored arrows point to two groups of inflammatory macrophages whose numbers increase in non-irradiated tumors in the RT/CD47-blockade treatment group. e, Number of cells in each subpopulation identified in the scRNA-seq analysis in the two treatment groups. f, Human NCI-H82 cells stably expressing green fluorescent protein (GFP) were engrafted into both flanks of NSG mice and only right-side tumors were irradiated. g, Example of a flow cytometry analysis of CD11b+F4/80+ macrophages also positive for GFP (indicative of phagocytosis) in the two treatments were irradiated. Schematic of the depletion on CD11b+ cells. h, Quantification of g. Phagocytosis was measured 6 d after treatment start as the percentage of CD11b+F4/80+ macrophages that are also GFP+. n = 1 experiment with n = 6 mice. ****P < 0.0001. Two-tailed Student’s t-tests following two-way ANOVA were performed in c (irradiated tumors, P < 0.0001; non-irradiated tumors, P < 0.0001). Two-tailed Student’s t-tests were performed in b and h. Error bars represent s.e.m. *P < 0.05, **P < 0.01, ***P < 0.001, ****P < 0.0001.

