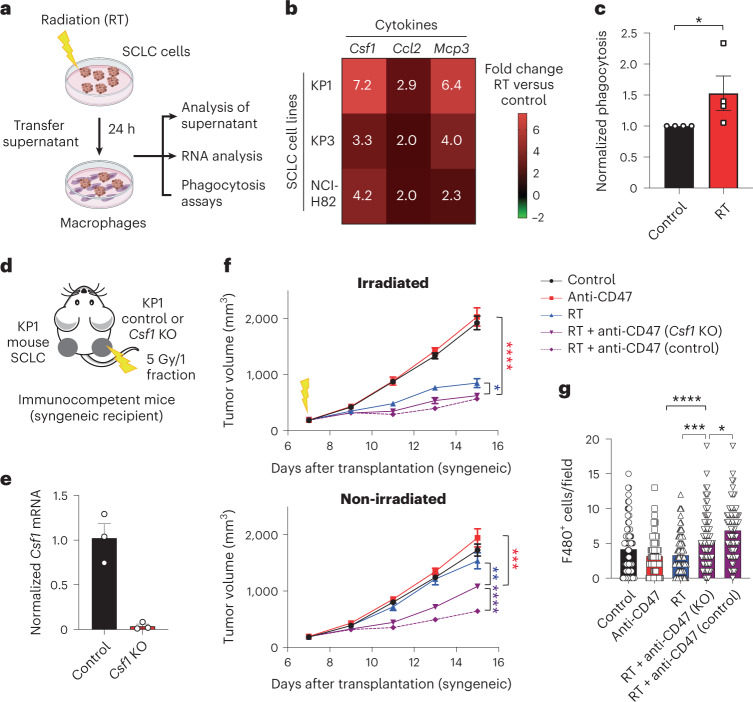
Fig. 5. Inflammatory macrophages respond to CSF1 produced by irradiated SCLC cells to mediate abscopal responses.
a, Schematic of the analysis of the response of SCLC cells to RT in culture. b, Heat map of relative mRNA levels for Csf1, Ccl2 and Mcp3 in irradiated KP1 and KP3 mouse SCLC cells and NCI-H82 human SCLC cells compared to non-irradiated control cells. n = 2 independent experiments (average values are shown). c, Flow cytometry analysis of in vitro phagocytosis assays with bone-marrow-derived macrophages and KP1 cells fluorescently labeled with calcein AM. n = 4 independent experiments shown as the average of technical triplicates. *P = 0.0286. d, Mouse KP1 control or Csf1 knockout (KO) SCLC cells were engrafted into the right flank of B6129SF1 immunocompetent syngeneic mice, with control KP1 cells on the left flank. Only the right side of tumors was irradiated. e, Relative mRNA level by quantitative PCR with reverse transcription (RT–qPCR) for Csf1 in KP1 control and Csf1 knockout cells. n = 3 technical replicates. f, Growth curves of KP1 allografts as in d at the irradiated and non-irradiated sites. n = 1 experiment with n = 8 mice. Irradiated tumors, ****P < 0.0001, *P = 0.0289; non-irradiated tumors, ***P = 0.0003, **P = 0.0081, ****P < 0.0001. g, Histological quantification of macrophage infiltration in non-irradiated KP1 control and Csf1 knockout tumors by immunostaining for F4/80 as in f. Each symbol represents one field quantified. n = 1 experiment with n = 7 (anti-CD47) or n = 8 (control, RT and RT + anti-CD47 (Csf1 KO) and RT + anti-CD47 (control)) mice. ****P < 0.0001, ***P = 0.0002, *P = 0.0177. Two-tailed unpaired Student’s t-tests were performed in c. Two-tailed Student’s t-tests following two-way ANOVA were performed in f (irradiated tumors, P < 0.0001; non-irradiated tumors, P < 0.0001). Two-tailed Student’s t-tests following one-way ANOVA were performed in g (P < 0.0001). Error bars represent s.e.m. *P < 0.05, **P < 0.01, ***P < 0.001, ****P < 0.0001.

