
Fig. 4. PDA clones engage different models of activation of the ISR.
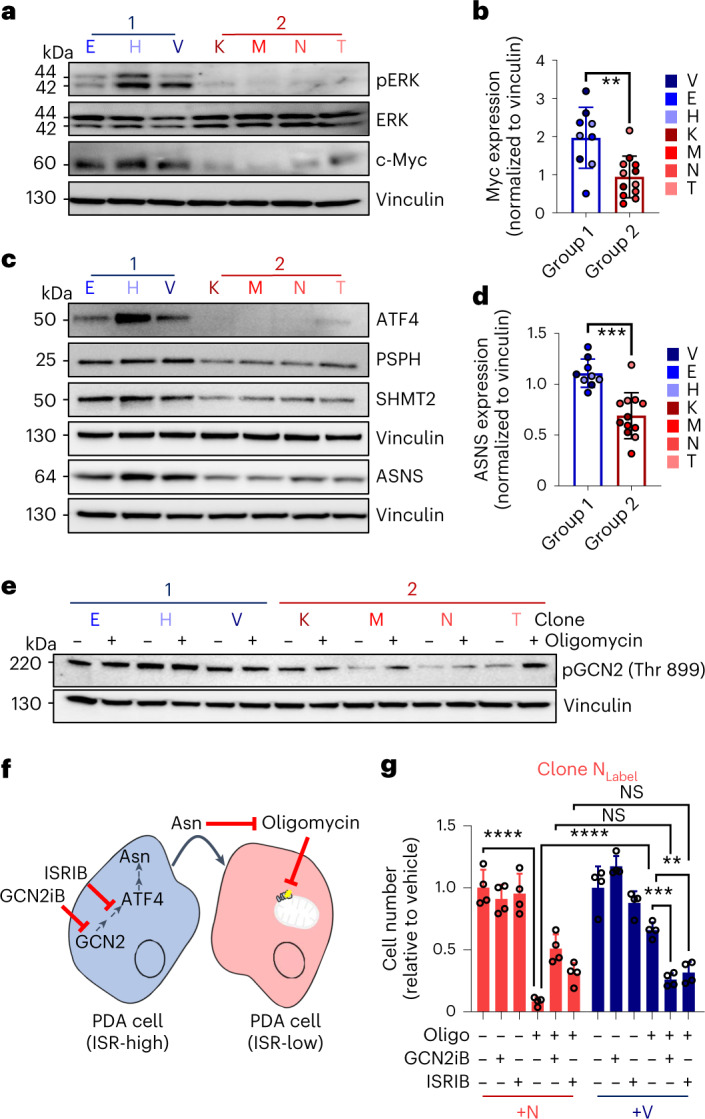
a, Immunoblot comparison of phospho-p44/42 MAPK Thr 202/Tyr 204 (pERK), total p44/42 MAPK (ERK), c-Myc and vinculin across group 1 (E, H and V) and group 2 (K, M, N and T) clonal populations. The image is representative of three independent experiments. b, Quantification of Myc expression across clonal groups normalized to vinculin loading controls (n = 3 blots per clone). c, Immunoblot comparison of ATF4, PSPH, SHMT2, ASNS and vinculin across group 1 (E, H and V) and group 2 (K, M, N and T) clonal populations. The image is representative of three independent experiments. d, Quantification of ASNS expression across clonal groups normalized to vinculin loading controls (n = 3 blots per clone). e, Expression of phospho-GCN2 T899 (pGCN2) and vinculin between group 1 (E, H and V) and group 2 (K, M, N and T) clonal populations treated with either vehicle or 1 nM oligomycin. f, Schematic representation of clonal cross-talk between ISR-high or ISR-low clones and key nodes to inhibit cross-talk. The image is representative of three replicates. g, Clonal line N was encoded with a fluorescent label, plated in direct coculture with unlabeled sensitive clone N or insensitive clone V and treated with oligomycin, ISRIB, GCN2iB, oligomycin and ISRIB, oligomycin and GCN2iB or vehicle (n = 3 replicates). Cells were counted, and endpoint data were plotted relative to vehicle; P ≤ 0.01, *** P ≤ 0.001 and **** P ≤ 0.0001 by two-tailed Mann–Whitney test (b and d) and one-way ANOVA with a Tukey post hoc test (g); P = 0.0043 (b), P = 0.0003 (d), +N versus +N + oligomycin P < 0.0001, +N + oligomycin versus +N + oligomycin P < 0.0001, +N + oligomycin + GCN2iB versus +V + oligomycin + GCN2iB P = 0.0844, +N + oligomycin + ISRIB versus +V + oligomycin + ISRIB P > 0.9999, +V + oligomycin versus +V + oligomycin + GCN2iB P = 0.0004 and +V + oligomycin versus +V + oligomycin + ISRIB P = 0.0038 (g).