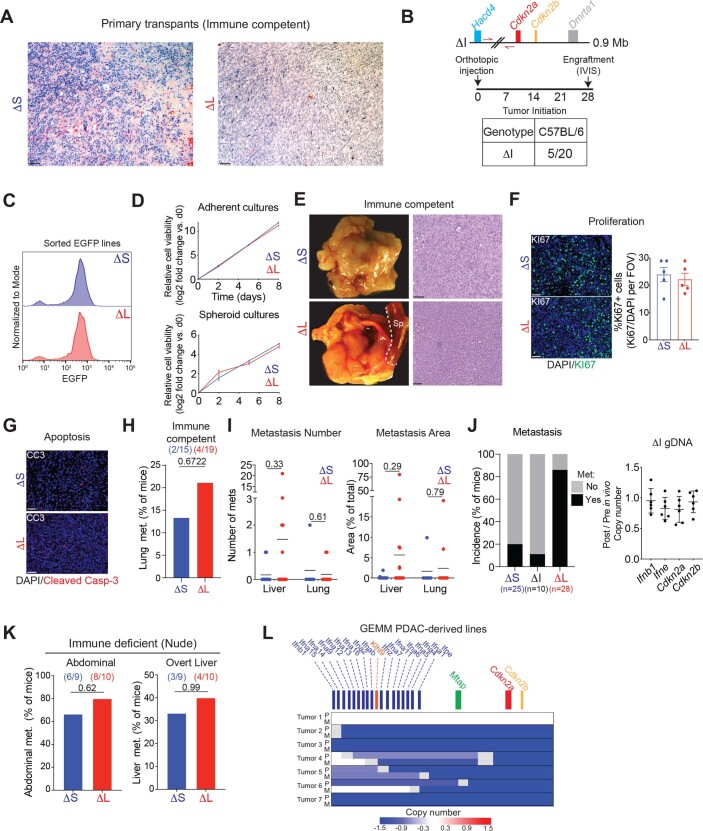
Extended Data Fig. 3. Large 4C4 deletions promote immune evasion and metastasis in a host-dependent manner.
(A) Histology of ΔS and ΔL tumors in C57BL/6 mice. Representative H/E images are shown. Scale bar is 100 μm. (B) (Top) Schematic representation of the MACHETE-engineered ΔI allele that removes a 0.9 Mb region between Hacd4 and Cdkn2a. (Bottom) Engraftment of ΔI cells in C57BL/6 mice one month after injection, measured by bioluminescence. (C) EGFP levels of representative re-sorted tumor-derived ΔS and ΔL cell lines (repeated 4 times). (D) Growth curves in adherent (top) or suspension (bottom) conditions for ΔS and ΔL cell lines. (E) Macroscopic images (left) and hematoxylin/eosin stain (right) of orthotopic tumors in C57BL/6 mice transplanted with tumor-derived ΔS and ΔL cells. Scale bar is 200 μm. (F) Representative images (left) and quantification (middle) of the fraction of Ki67+ cells in ΔS and ΔL tumors. Scale bar is 100 μm. Each dot represents an independent biological replicate (n = 5). (G) Representative images of cleaved caspase-3 in ΔS and ΔL tumors, which showed little to no detectable signal. Scale bar is 100 μm. (H) Lung metastasis incidence in C57BL/6 mice with either ΔS or ΔL tumors. Bars represent the fraction of metastasis-bearing mice. Differences were assessed by Fisher’s exact test. Each dot represents an independent biological replicate (ΔS n = 17, ΔL n = 23). (I) Quantification of the number (left) and relative area (right) of liver and lung metastases in C57BL/6 mice with either ΔS or ΔL tumors. Each dot represents an independent biological replicate (Liver ΔS n = 12, ΔL n = 21; Lung ΔS n = 6, ΔL n = 11). Differences were assessed by two-tailed unpaired test. (J) (Left) Metastasis incidence in C57BL/6 mice with ΔS, ΔI, or ΔL tumors. (Right) Copy number of Ifnb1, Ifne, Cdkn2a, and Cdkn2b in tumor-derived ΔI lines (Post) relative to pre-injection parental ΔI cells (Pre). Each dot represents an independent tumor-derived line (n = 5). ΔS and ΔL data are also used in Fig. 4. (K) Metastasis incidence in Nude mice with either ΔS or ΔL tumors. Each dot represents an independent biological replicate (Abdominal ΔS n = 9, ΔL n = 10; Liver ΔS n = 9, ΔL n = 10). (L) Analysis of 4C4 deletion status in PDAC GEMM cell lines derived from matched primary tumors (‘P’) and metastases (‘M’). Each row is paired primary and metastasis-derived cell lines (n = 7 pairs). Sparse WGS was used to assess the status of the 4C4 locus. Deep blue color depicts deletion, defined as log2 relative abundance < −2.

