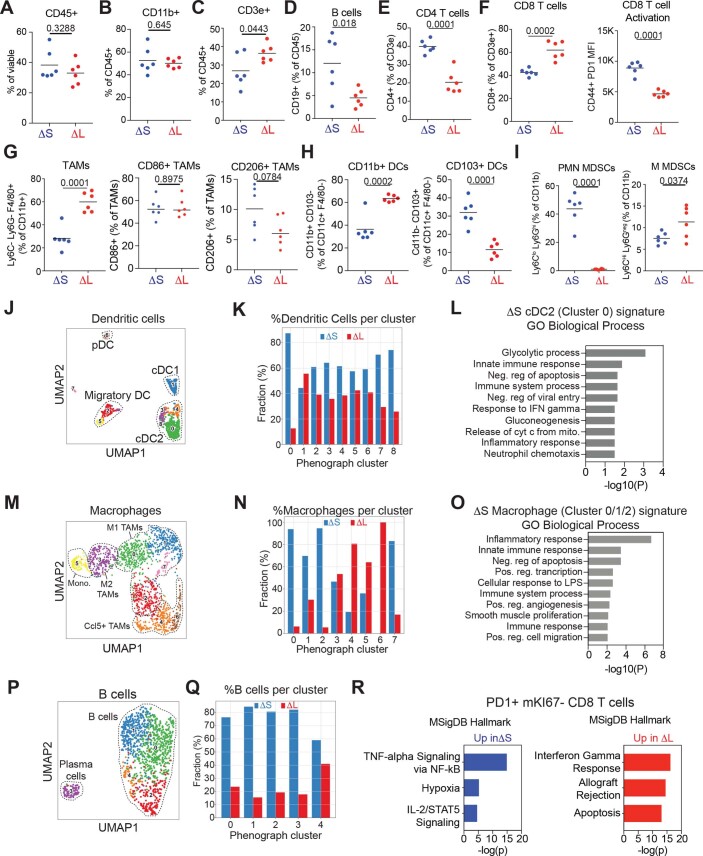
Extended Data Fig. 6. 4C4 deletions alter the state of antigen presenting cells.
(A-I) Immunophenotyping of infiltrating populations in ΔS and ΔL tumors. Frequency of CD45+ cells (A), CD11b+ cells (B), CD3e+ cells (C), CD19+ B cells (D), CD4+ T cells (E), CD8+ T cells and corresponding PD1 mean fluorescence intensity of CD44+CD8+ T cells (F), tumor-associated macrophages (TAMs) including CD86 + and CD206 + subtypes (G), CD11b+ and CD103+ dendritic cell subsets (H), and myeloid-derived suppressor cells (MDSCs) including polymorphonuclear (PMN-MDSCs) and mononuclear (M-MDSCs) subtypes (I). Differences were assessed by unpaired two-tailed t-test. Each dot represents an independent biological replicate (ΔS n = 6, ΔL n = 6). (J) UMAP of dendritic cell phenographs from ΔS or ΔL tumors. Known populations/states are circled. (K) Frequency of dendritic cells across phenographs in ΔS or ΔL tumors. (L) DAVID analysis of Gene Ontology Biological Processes enriched in ΔS-specific dendritic cells in Cluster 0 (green cluster in panel J). (M) UMAP of macrophage phenographs from ΔS or ΔL tumors. Known populations/states are circled. (N) Frequency of macrophages across phenographs in ΔS or ΔL tumors. (O) DAVID analysis of Gene Ontology Biological Processes enriched in ΔS-specific macrophages in clusters 0-2 (green, blue, and red clusters in panel M). (P) UMAP of B cell phenographs from ΔS or ΔL tumors. Known populations/states are circled. (Q) Frequency of B cells across phenographs in ΔS or ΔL tumors. (R) Enrichr analysis of the top Hallmark Pathways enriched in exhausted CD8 + T cells from ΔS and ΔL tumors.

