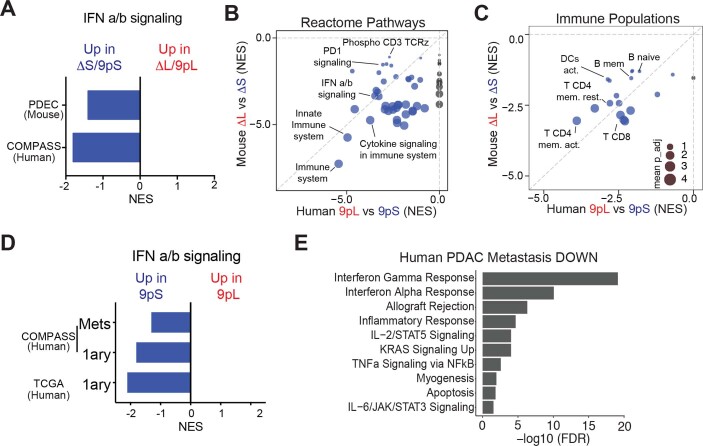
Extended Data Fig. 7. Conserved effects of human 9p21.3 and mouse 4C4 on PDAC immune infiltration.
(A) GSEA enrichment scores (NES) of type I IFN signaling in mouse ΔS and human 9pS tumors compared to ΔL and 9pL tumors, respectively. (B) Comparison of GSEA NES scores for Reactome Pathways enriched in mouse ΔS (y axis) and human 9pS tumors (x axis). Highlighted are key pathways and immune populations enriched in IFN-proficient tumors. Circle size represents the adjusted p value (the scale is shown in panel C). Patient data is from primary tumors (9pS n = 37 patients and 9pL n = 28 patients). (C) Comparison of GSEA NES scores and Immune populations enriched in mouse ΔS (y axis) and human 9pS tumors (x axis). Highlighted are key immune populations enriched in IFN-proficient tumors. Circle size represents -log(adjusted p value). Patient data is from primary tumors (9pS n = 37 patients and 9pL n = 28 patients). (D) GSEA enrichment scores (NES) of type I IFN signaling in human primary (1ary) or metastatic (Mets) 9pS tumors compared to 9pL tumors from the COMPASS and TCGA datasets. (E) Hallmark pathways downregulated in human PDAC liver metastases vs. primary tumors. Data from Moffitt et al., 201572.

