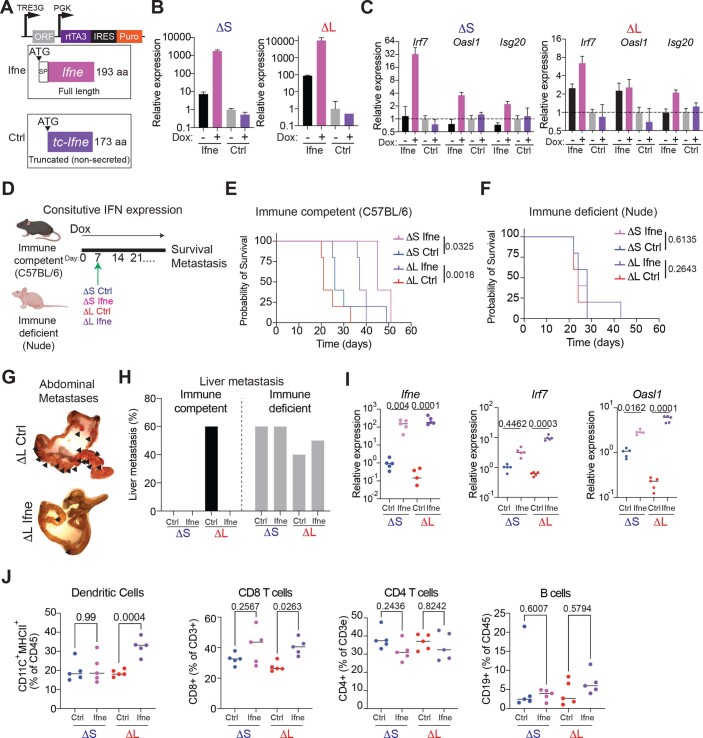
Extended Data Fig. 9. Ifne overexpression blunts metastasis by engaging adaptive immunity.
(A) Design of the vector for doxycycline-inducible expression of full-length mouse Ifne or, as control, a truncated version lacking the signal peptide. (B) Representative RT-qPCR of Ifne expression in cells cultured -/+ doxycycline (2 μg/mL) for 72 hours. The assay specifically amplifies full-length Ifne. Bars represent median and upper/lower limits. Experiment was repeated n = 2 with similar results. (C) Representative RT-qPCR of IFN target genes (Irf7, Oasl1, Isg20) in cells cultured -/+ doxycycline (2 μg/mL) for 72 hours. Bars represent median and upper/lower limits. Experiment was repeated n = 2 with similar results. (D) Experimental design to test the role of sustained Ifne expression in immune competent and immune deficient mice. (E) Survival curve of immune competent mice orthotopically transplanted with Ctrl or Ifne overexpressing ΔS and ΔL cells. n = 5 independent biological replicates. Differences were assessed by log rank test. (F) Survival curve of immune deficient (nude) mice orthotopically transplanted with Ctrl or Ifne overexpressing ΔS and ΔL cells. n = 5 independent biological replicates. Differences were assessed by log rank test. (G) Representative image of an intestine from a mouse with sustained expression of Ctrl or full-length Ifne ΔL cells at endpoint. Arrowheads point to macrometastases in the mesentery and intestine. (H) Incidence of overt liver metastasis in immune proficient and immune deficient hosts transplanted with ΔS or ΔL cells expressing Ctrl or full-length Ifne (n = 5 independent biological replicates). (I) RT-qPCR of Ifne, Irf7, and Oasl1 in tumors from immune competent mice treated with doxycycline for 1 week before tumor analysis. Each dot represents a tumor from an independent mouse (n = 5 independent biological replicates). Differences were assessed by one-way ANOVA followed by Sidak’s multiple comparison test. (J) Frequency of dendritic cells (far left), CD8 T cells (left), CD4 T cells (right), and B cells (far right) are shown. Each dot represents a tumor from an independent mouse (n = 5 independent biological replicates). Differences were assessed by one-way ANOVA followed by Sidak’s multiple comparison test.

