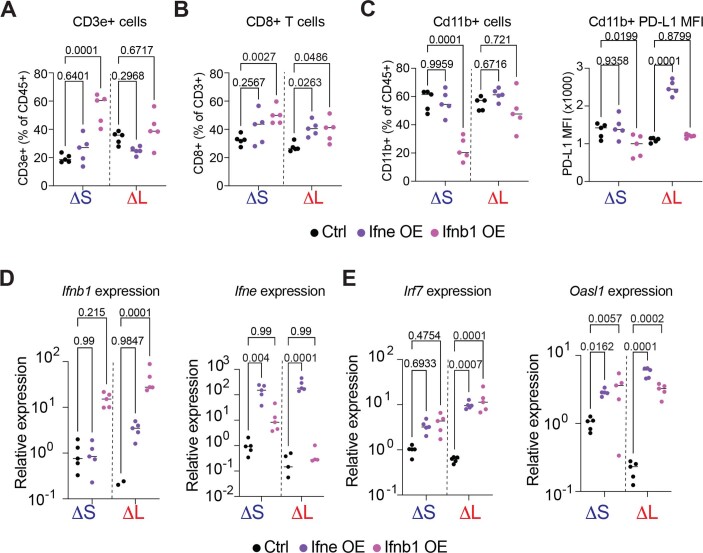
Extended Data Fig. 10. Ifne and Ifnb1 show distinct effects on immune infiltrating cells.
(A) Frequency of T cells (CD3e + ). Differences were assessed by one-way ANOVA followed by Sidak’s multiple comparison to the respective control population. Each dot is a tumor from an independent mouse (n = 5 independent biological replicates). (B) Frequency of CD8 + T cells from ΔS and ΔL tumors treated for one week with Dox. Differences were assessed by one-way ANOVA followed by Sidak’s multiple comparison to the respective control population. Each dot is a tumor from an independent mouse (n = 5 independent biological replicates). Control and Ifne data are also used in Extended Data Fig. 9J. (C) (Left) Frequency of CD11B + cells (CD11B + CD3e-); (Right) Median PD-L1 surface expression in CD11B + cells, from ΔS and ΔL tumors treated for one week with Dox. Differences were assessed by one-way ANOVA followed by Sidak’s multiple comparison to the respective control population. Each dot is a tumor from an independent mouse (n = 5 independent biological replicates). Control and Ifne data are used in Extended Data Fig. 9J. (D-E) Relative expression of Ifnb1, Ifne (D); Irf7, and Oasl1 (E) in ΔS and ΔL tumors with add-back of Ifnb1, Ifne, or control construct. Differences were assessed by one-way ANOVA followed by Sidak’s multiple comparison to the respective control population. Each dot is a tumor from an independent mouse (n = 5 independent biological replicates). Control and Ifne data are also used in Extended Data Fig. 9.

