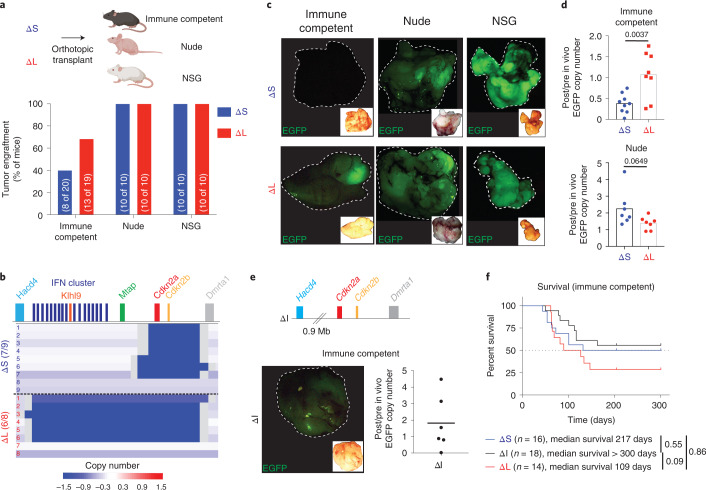
Fig. 3. Large 4C4 deletions evade immunoediting.
a, Tumor engraftment at 1 month after injection of ΔS and ΔL cells in C57BL/6, nude and NSG hosts. Two independently generated input cell lines were used per genotype. Bars represent fraction of tumor-bearing mice (specific numbers of independently analyzed mice are noted in parentheses). b, Sparse whole-genome sequencing analysis of 4C4 deletion status in ΔS and ΔL tumor-derived cell lines (from C57BL/6 hosts). Each row is an independent tumor-derived line (ΔS, n = 9; ΔL, n = 8). Deep blue color depicts deletion defined as log2 relative abundance <−2. c, Representative macroscopic fluorescent images of primary tumors collected from the indicated genotypes and hosts (Images were taken from ten mice per genotype per host). Insets show the brightfield image for each tumor. d, qPCR analysis for EGFP copy number in the genomic DNA of tumor-derived (post in vivo) ΔS and ΔL lines from C57BL/6 and nude hosts, relative to their parental (pre in vivo) counterparts. Each dot represents an independent tumor-derived cell line (n = 8 C57BL/6, 7 nude; for ΔS and ΔL). Groups were compared using a two-tailed unpaired Student’s t-test. e, Schematic representation of the MACHETE-engineered ΔI allele that removes an 0.9-Mb region between Hacd4 and Cdkn2a (top). Representative macroscopic image of a ΔI tumor showing retained EGFP expression at end point (bottom left). Inset shows matched brightfield image. qPCR analysis for EGFP copy number in the genomic DNA of tumor-derived (post in vivo) ΔI cell lines from C57BL/6 hosts relative to their parental (pre in vivo) counterparts (bottom right). Each dot represents an independent cell line (n = 6). f, Survival curve of C57BL/6 mice transplanted with ΔS, ΔI, or ΔL tumor cells. Curves were compared using a log-rank test.

