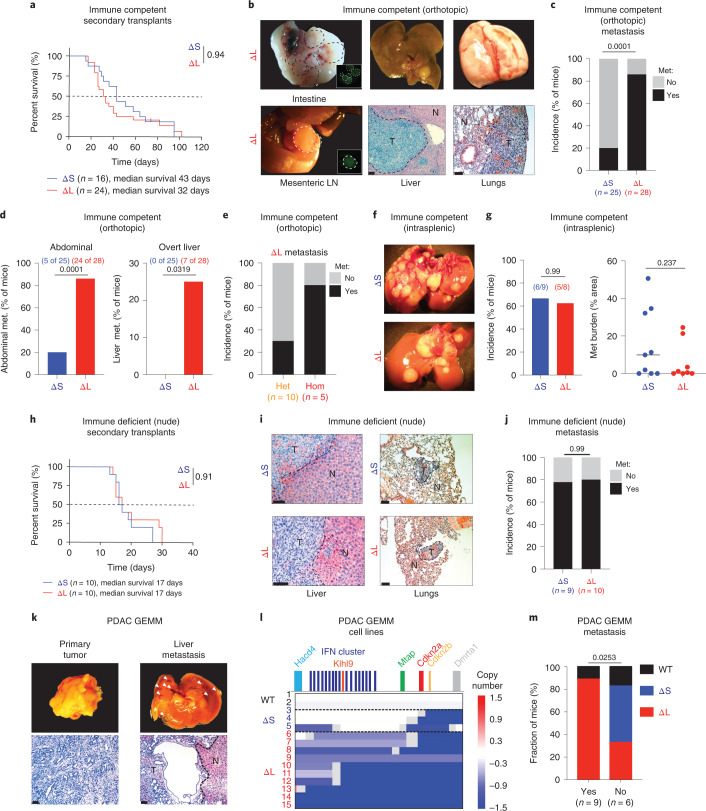
Fig. 4. Large 4C4 deletions promote metastasis.
a, Survival curve of C57BL/6 mice transplanted with tumor-derived ΔS and ΔL cells. Curves were compared using a log-rank test. b, Representative images of metastases in C57BL/6 mice with ΔL tumors. Brightfield macroscopic images of abdominal (intestinal and mesenteric lymph node (LN)) metastases (met.) (left). Insets show matched EGFP fluorescence images. Macroscopic and hematoxylin & eosin images of tumor-bearing livers (middle). Scale bar, 200 μm. Macroscopic and hematoxylin & eosin images of tumor-bearing lungs (right). Scale bar, 100 μm. T, tumor; N, normal adjacent tissue. c–e, Overall (c), organ-specific (d) and zygosity-specific (e) metastasis incidence in C57BL/6 mice. Two to four independently generated input cell lines were used per genotype. Bars represent fraction of metastasis-bearing mice (independently analyzed mice are noted in parentheses) and differences were assessed with Fisher’s exact test. f, Macroscopic images of liver metastases in C57BL/6 mice after intrasplenic injection of either ΔS or ΔL cells. g, Incidence and relative area of liver metastases in C57BL/6 mice after intrasplenic injection of either ΔS or ΔL cells. Bars represent fraction of metastasis-bearing mice (independently analyzed mice are noted in parentheses) (left). Each dot represents an independent mouse (ΔS, n = 9; ΔL, n = 8) (right). Differences were assessed with Fisher’s exact test and burden with an unpaired two-tailed Student’s t-test. h, Survival curves of nude mice transplanted with tumor-derived ΔS or ΔL cells. Curves were compared using a log-rank test. i, Representative images of metastases in nude mice with ΔL or ΔS tumors. Hematoxylin/ eosin images of tumor-bearing livers (left) and lungs (right) are shown. Scale bar, 100 μm. j, Overall metastasis incidence in nude mice. Bars represent fraction of independent mice with metastasis, ΔS (n = 9) or ΔL (n = 10) tumors. Differences were assessed with Fisher’s exact test. k, Representative gross morphology (top) and hematoxylin & eosin histological stain (bottom) of matched primary tumor and overt liver metastasis in a KrasG12D/+; shSmad4 PDAC GEMM. Scale bar, 200 μm. l, Sparse WGS analysis of tumor-derived cell lines from the KC-Ren and KC-Smad4 GEMMs, grouped by spontaneous 4C4 deletion type (WT, ΔS and ΔL). Blue tracks indicate deleted regions, with color intensity corresponding to the extent of the deletion. Numbers correspond to independent mice. (M) Incidence of WT 4C4 locus, ΔS deletion or ΔL deletion among tumors with or without associated overt metastases. Specific numbers of independently analyzed mice are noted in parentheses. Differences were assessed with chi-squared test.

