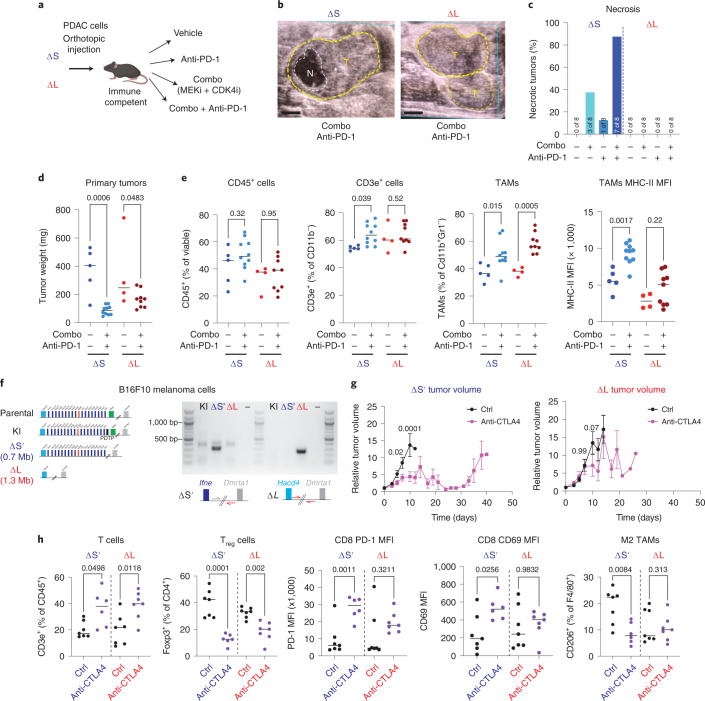
Fig. 5. Loss of type I IFNs alters the response to ICB.
a, Experimental setup to test the effects of ICB in ΔS and ΔL tumors. b, Representative ultrasound images of tumors (T, circled in yellow) with observed necrotic region (N, circled in white) (left). Scale bars, 1 mm. c, Frequency of necrosis in ΔS and ΔL tumors. (n = 8–9 independent mice per group). MFI, mean fluorescence intensity. d, ΔS and ΔL tumor weights 1 week after vehicle or combo + PD-1 treatment. Differences were assessed with one-way analysis of variance (ANOVA) followed by Sidak’s multiple comparison between vehicle and combo + PD-1-treated tumors (ΔS vehicle n = 5, ΔS treated n = 10, ΔL vehicle n = 4, ΔL treated n = 9 independent mice per condition). e, Frequency of CD45+ (far left), CD3e+ (left), TAMs (right) and surface expression of major histocompatibility complex (MHC)-II in TAMs (far right) in ΔS and ΔL tumors treated with vehicle or combo + PD-1. Differences were assessed with one-way ANOVA followed by Sidak’s multiple comparison between vehicle and combo + PD-1-treated tumors (ΔS vehicle n = 5, ΔS treated n = 10, ΔL vehicle n = 4, ΔL treated n = 9 independent mice per condition). f, Schematic of the ΔS′ and ΔL alleles engineered in B16F10 cells to test the response to anti-CTLA4 (left). Genotyping PCR of the expected breakpoints for the ΔS′ and ΔL alleles (right). g, ΔS′ (left) or ΔL (right) tumor volume after treatment with vehicle or anti-CTLA4 (n = 10 independent mice per group). Dots represent mean and bars represent s.e.m. Differences were assessed with two-way ANOVA followed by Sidak’s multiple comparison between vehicle and anti-CTLA4-treated tumors. h, Frequency of T cells (CD3e+CD11B−) (far left); frequency of Foxp3+ T regulatory cells (left); surface levels of PD-1 in CD8+ T cells (middle); surface levels of CD69 in CD8+ T cells (right); and frequency of CD206+ TAMs (far right) in ΔS′ and ΔL tumors treated for 1 week with vehicle or anti-CTLA4. Differences were assessed with one-way ANOVA followed by Sidak’s multiple comparison between vehicle and anti-CTLA4 (ΔS vehicle n = 7, ΔS-treated n = 6, ΔL vehicle n = 7 and ΔL-treated n = 7 independent mice per condition).

