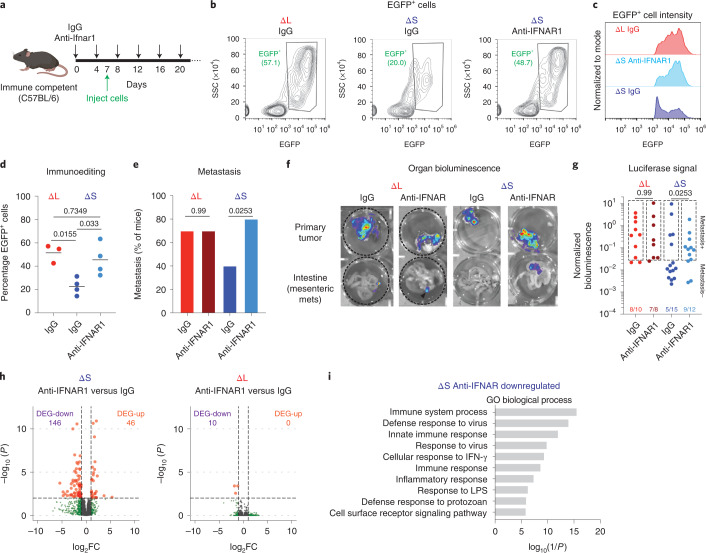
Fig. 7. IFNAR1 blockade promotes immune evasion and metastasis.
a, Experimental outline to test the role of IFNAR1 signaling in transplantation experiments. b, Representative flow cytometry plots of ΔS or ΔL tumors from C57BL/6 mice treated with IgG or αIFNAR1 antibodies. SSC, side scatter. c, Representative flow cytometry plots of EGFP+ populations from IgG ΔL, IgG ΔS or anti-IFNAR1 ΔS tumors. d, Quantification of EGFP+ cells in ΔS or ΔL tumors from C57BL/6 mice treated with IgG or anti-IFNAR1 antibodies. Each dot represents an independent biological replicate (IgG ΔS n = 4, anti-IFNAR1 ΔS n = 4, IgG ΔL n = 3). Differences were assessed with one-way ANOVA followed by Tukey’s multiple comparison. e, Incidence of metastasis in C57BL/6 mice transplanted with homozygous ΔS or ΔL lines and treated with IgG or anti-IFNAR1 antibodies. Two independently generated input cell lines were used per genotype and independent mice were assessed (IgG ΔS n = 15, anti-IFNAR1 ΔS n = 10, IgG ΔL n = 10, anti-IFNAR1 ΔL n = 8). Differences were assessed with chi-squared test. f, Representative bioluminescent images of primary tumors and intestines from mice with the indicated genotypes of transplanted cells and antibody treatments. g, Quantification of all replicates. Boxes indicate signals above the threshold for metastasis detection. Two independently generated input cell lines were used per genotype and independent mice were assessed (IgG ΔS n = 15, anti-IFNAR1 ΔS n = 12, IgG ΔL n = 10, anti-IFNAR1 ΔL n = 8). Differences were assessed with chi-squared test. h, Volcano plots of differentially expressed genes (DEGs) comparing IFNAR1 blockade versus IgG controls in ΔS or ΔL tumors. Up, upregulated; down, downregulated. i, DAVID Gene Ontology analysis of anti-IFNAR1 downregulated genes in ΔS tumors. Top ten significant pathways are shown.

