Figure 2:

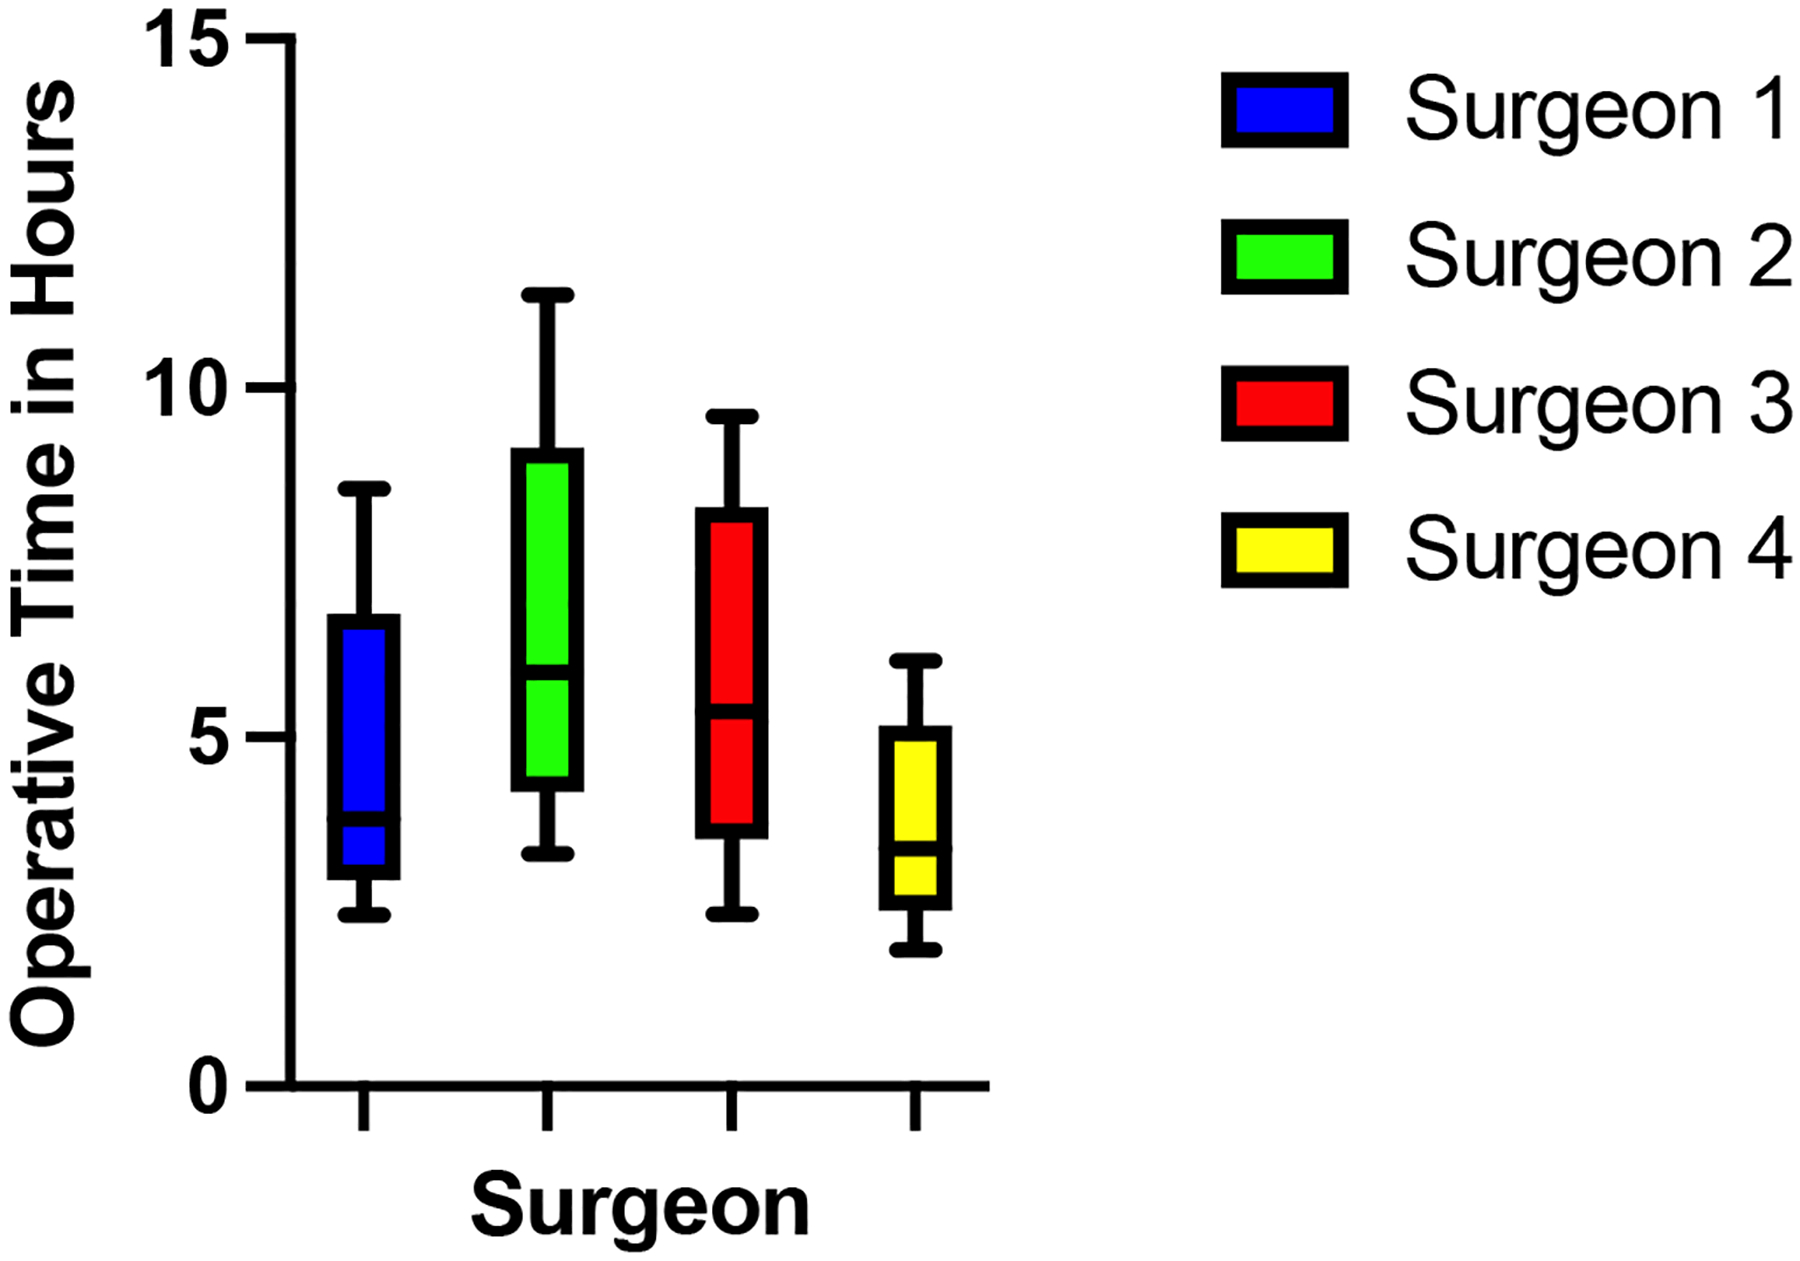
Box and whisker plot of the variability of each surgeon’s operating time. The whiskers represent minimum and maximum values. The box represents median, first and third quartile of operating times.

Box and whisker plot of the variability of each surgeon’s operating time. The whiskers represent minimum and maximum values. The box represents median, first and third quartile of operating times.